The internet has become a cornerstone of modern life, connecting billions of people across the globe. In 2025, over 5.65 billion individuals—approximately 68.7% of the world’s population—actively use the internet.
This article dives deep into the latest internet usage statistics for 2025, offering insights into global trends, regional differences, device preferences, and how individuals and businesses can leverage these trends for their benefit.
We’ve also incorporated fresh perspectives from platforms like Quora and Reddit to address what users are asking about internet usage today.
Whether you’re a student, entrepreneur, or curious individual, this guide will help you understand the digital landscape and how to make the most of it.
The Global Internet Landscape in 2026
The internet’s reach continues to expand, driven by affordable smartphones, improved infrastructure, and the growing popularity of online services like e-commerce, social media, and streaming platforms.
In 2025, the global internet user base grew by 200 million from 5.45 billion in July 2024, reflecting a steady upward trend. This growth underscores the internet’s role as a vital tool for communication, education, and economic opportunity.
Key Global Internet Usage Statistics
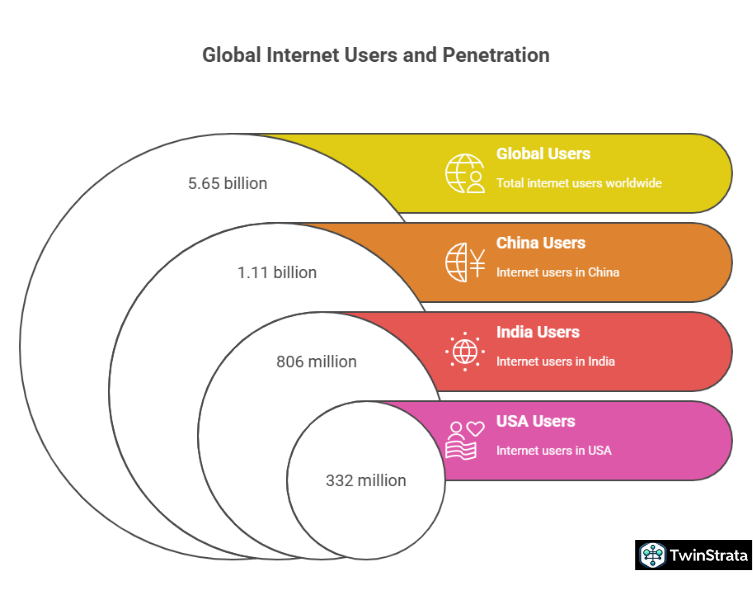
- 5.65 billion people use the internet worldwide, equating to 68.7% of the global population.
- The global internet penetration rate stands at 67.9%, with Northern Europe leading at 97.7% and Eastern Africa trailing at 28.5%.
- On average, people spend 6 hours and 36 minutes online daily, with mobile devices accounting for 54.67% of web traffic.
- China leads with 1.11 billion internet users, followed by India with 806 million and the United States with 332 million.
Growth of Internet Users Over Time
The internet’s global adoption has accelerated over the past decade. Here’s a look at the growth trajectory:
| Year | Number of Internet Users | Percentage of Global Population |
| 2025 | 5.65 billion | 68.7% |
| 2024 | 5.45 billion | 67.1% |
| 2023 | 5.28 billion | 64.5% |
| 2022 | 5.14 billion | 62.5% |
| 2021 | 4.91 billion | 59.5% |
| 2020 | 4.63 billion | 59% |
| 2019 | 4.18 billion | 57% |
| 2018 | 3.85 billion | 53% |
| 2017 | 3.679 billion | 50% |
| 2016 | 3.423 billion | 46% |
Source: World Bank Group
This table shows a consistent increase, with a notable jump from 50% penetration in 2017 to 68.7% in 2025, highlighting the internet’s growing accessibility.
Internet Usage by Country
China dominates with 1.11 billion internet users, representing 78.17% of its population. India follows with 806 million users (55.1% penetration), and the United States ranks third with 332 million users (95.68% penetration).
These numbers reflect the influence of population size and infrastructure development on internet adoption.
Top 10 Countries by Number of Internet Users
| Rank | Country | Internet Users | Population | Penetration Rate |
| 1 | China | 1.11 billion | 1.416 billion | 78.17% |
| 2 | India | 806 million | 1.464 billion | 55.1% |
| 3 | United States | 332 million | 347 million | 95.68% |
| 4 | Indonesia | 212 million | 286 million | 74.13% |
| 5 | Brazil | 183 million | 213 million | 85.92% |
| 6 | Russia | 133 million | 144 million | 92.36% |
| 7 | Pakistan | 116 million | 255 million | 45.49% |
| 8 | Mexico | 110 million | 132 million | 83.33% |
| 9 | Japan | 109 million | 123 million | 88.62% |
| 10 | Nigeria | 107 million | 238 million | 44.96% |
Source: Statista
Countries with the Highest Internet Penetration Rates
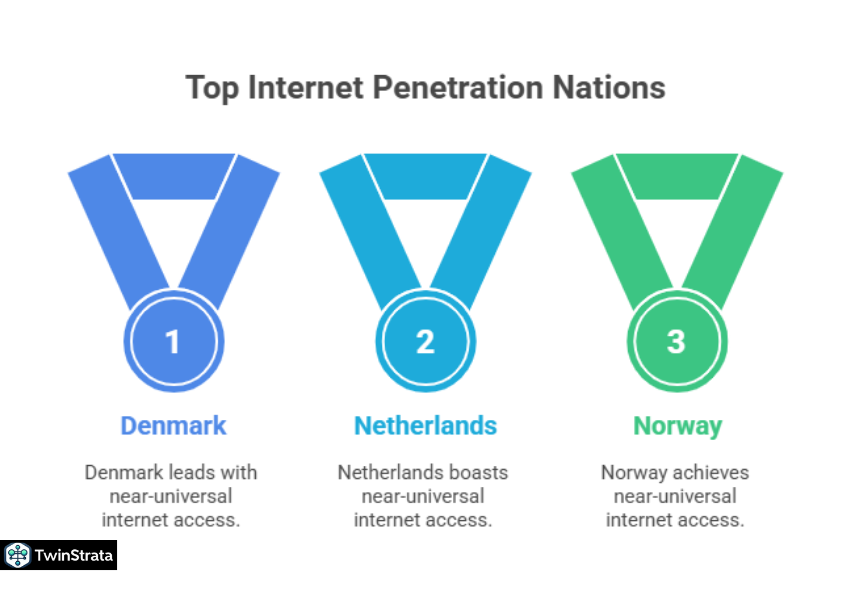
Some nations boast near-universal internet access. The top six countries—Denmark, Netherlands, Norway, Saudi Arabia, Switzerland, and the UAE—have a 99% penetration rate. Other high-ranking nations include:
| Rank | Country | Region | Penetration Rate |
| 1 | Denmark | Europe | 99% |
| 1 | Netherlands | Europe | 99% |
| 1 | Norway | Europe | 99% |
| 1 | Saudi Arabia | Asia | 99% |
| 1 | Switzerland | Europe | 99% |
| 1 | UAE | Asia | 99% |
| 7 | Ireland | Europe | 98.9% |
| 8 | Sweden | Europe | 98.3% |
| 9 | Finland | Europe | 98.2% |
| 10 | UK | Europe | 97.8% |
These high penetration rates reflect advanced infrastructure and widespread digital literacy, offering lessons for other nations aiming to boost connectivity.
Regional Internet Penetration
Internet access varies significantly by region. Northern Europe leads with a 97.7% penetration rate, while Eastern Africa lags at 28.5%. Here’s a breakdown:
| Region | Share of Global Internet Users | Penetration Rate |
| East Asia | 23.3% | 78.5% |
| South Asia | 20.1% | 53.8% |
| South-East Asia | 9.8% | 78.2% |
| South America | 6.5% | 83.2% |
| North America | 6.5% | 93.3% |
| Eastern Europe | 4.6% | 90.6% |
| West Asia | 4.3% | 75.9% |
| North Africa | 3.6% | 73% |
| West Africa | 3.5% | 42.5% |
| Western Europe | 3.4% | 95.1% |
| Central America | 2.6% | 79.2% |
| East Africa | 2.6% | 28.5% |
| Southern Europe | 2.5% | 91.6% |
| Northern Europe | 1.9% | 97.7% |
| Central Africa | 1.3% | 33.6% |
| Central Asia | 1.2% | 80.8% |
| South Africa | 1% | 77% |
| Oceania | 0.6% | 77.5% |
| Caribbean | 0.6% | 69.8% |
Populous nations like China drive east Asia’s high user share (23.3%), while low penetration in regions like East Africa highlights infrastructure challenges.
The Unconnected Population
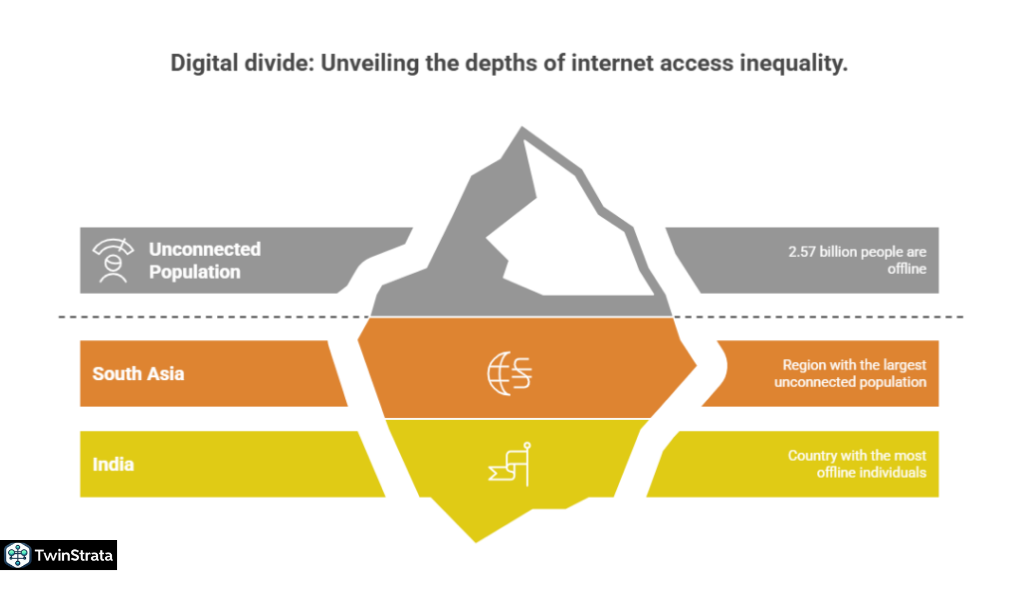
Despite global progress, 2.57 billion people remain offline. South Asia has the largest unconnected population (958.8 million), primarily due to India’s 651.6 million offline individuals. Here are the top 10 nations with the largest unconnected populations:
| Rank | Nation | Region | Unconnected Population | % Offline |
| 1 | India | Asia | 651.6 million | 44.7% |
| 2 | China | Asia | 311.9 million | 22% |
| 3 | Pakistan | Asia | 137.5 million | 54.3% |
| 4 | Nigeria | Africa | 128.3 million | 54.6% |
| 5 | Ethiopia | Africa | 105.2 million | 78.7% |
| 6 | Bangladesh | Asia | 96.9 million | 55.5% |
| 7 | DR Congo | Africa | 77.1 million | 69.4% |
| 8 | Indonesia | Asia | 72.2 million | 25.4% |
| 9 | Tanzania | Africa | 49.3 million | 70.9% |
| 10 | Uganda | Africa | 36.5 million | 72% |
Nations like North Korea and Burundi have over 80% offline populations, often due to political or economic barriers.
Device Usage Trends
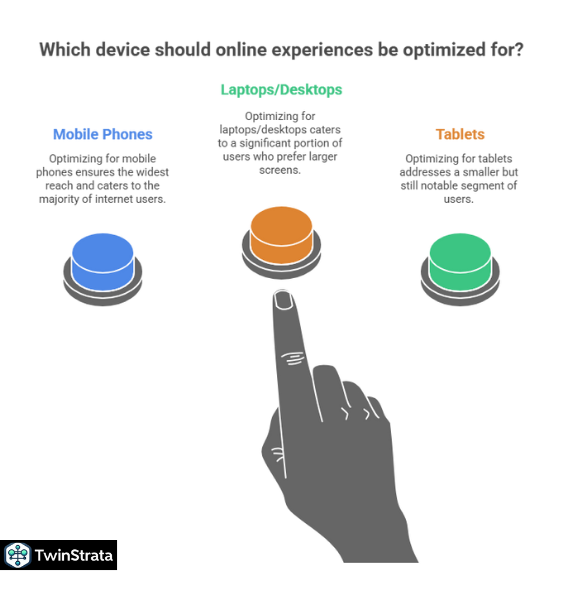
Mobile devices dominate internet access, with 95.9% of users worldwide connecting via mobile phones. Smartphones account for 93.7% of this share, while 62.2% use laptops or desktops, and 27.6% use tablets.
Device Usage Breakdown
| Device | Share of Internet Users |
| Mobile phone (any) | 95.9% |
| Smartphone | 93.7% |
| Laptop or desktop | 62.2% |
| Personal laptop | 54% |
| Connected television | 31.6% |
| Work laptop or desktop | 27.7% |
| Tablet device | 27.6% |
| Smart home device | 18.1% |
| Games console | 11.5% |
| Feature phone | 4.5% |
| Virtual reality device | 4.4% |
Time Spent Online by Device
- Mobile Devices: Users spend 4 hours and 49 minutes daily on mobile internet, totaling 33 hours and 42 minutes weekly.
- Computers: The global average for computer-based internet use is 2 hours and 52 minutes daily, with Russia leading at 4 hours and 31 minutes.
South Africans spend the most time online overall (9 hours and 37 minutes daily), with 5 hours and 11 minutes on mobile devices.
Demographic Insights
Gender Demographics
Globally, 69.8% of males and 64.4% of females use the internet, reflecting a slight gender gap. In the United States, 96% of men and 97% of women are online, showing near-equal access.
| Year | Male (US) | Female (US) |
| 2024 | 96% | 97% |
| 2023 | 94% | 96% |
| 2021 | 94% | 93% |
| 2019 | 90% | 91% |
| 2018 | 89% | 88% |
Age Demographics
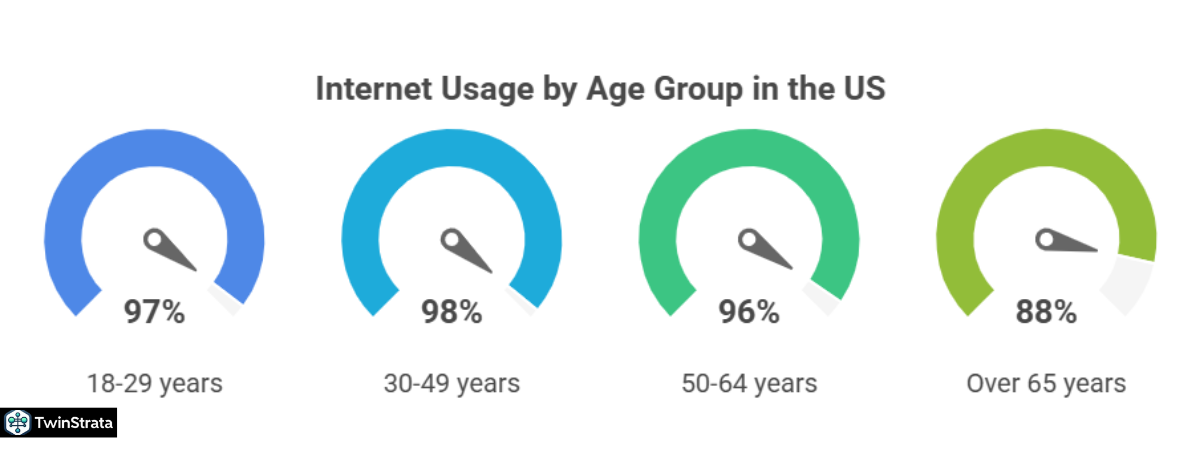
In the US, adults aged 30-49 years lead with 98% internet usage, while those over 65 years have an 88% usage rate.
| Age Group | Share of Internet Users (US) |
| 18-29 years | 97% |
| 30-49 years | 98% |
| 50-64 years | 96% |
| Over 65 years | 88% |
Generational Trends
Recent discussions on Quora and Reddit highlight growing internet use among Gen Alpha (born 2010-2024). Over 73% of Gen Alpha globally use the internet, often for educational content, gaming, and social media. Parents on Reddit note concerns about screen time but also value the internet’s role in learning and creativity.
Search Engine and Social Media Usage
Search Engine Statistics
Search engines remain a primary internet tool, with 81.8% of users relying on them monthly. Google holds a 90.48% share of the global search market and 94.69% of the mobile search market.
- 16.4 billion searches occur daily on Google, equating to 190,000 searches per second.
- 1 billion voice searches and 8 billion Google Lens visual searches occur monthly.
- Also read about: Google Searches Statistics
Social Media Statistics
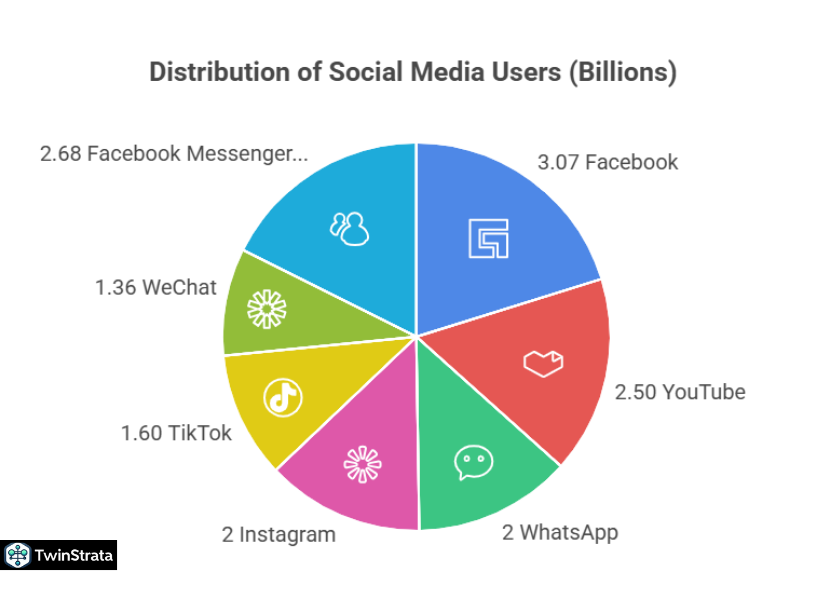
Social media platforms engage 5.41 billion users globally, or 66.4% of the population. Users spend an average of 2 hours and 40 minutes daily on these platforms.
| Platform | Number of Users |
| 3.07 billion | |
| YouTube | 2.50 billion |
| 2 billion | |
| 2 billion | |
| TikTok | 1.60 billion |
| 1.36 billion | |
| Facebook Messenger | 977 million |
| Telegram | 900 million |
| Snapchat | 800 million |
In the US, 253 million people (70.1% of internet users) use social media, with platforms like TikTok gaining traction among younger audiences.
Emerging Trends from Quora and Reddit
Recent discussions on Quora and Reddit reveal user curiosity about:
- Digital Nomadism: Many ask how to leverage high-speed internet for remote work. Users suggest focusing on cloud-based tools and reliable VPNs to enhance productivity.
- Online Privacy: Concerns about data security are prevalent, with users recommending encrypted browsers and ad-blockers to protect personal information.
- E-learning Platforms: Students on Reddit highlight the rise of platforms like Coursera and Khan Academy, driven by accessible internet in developing regions.
- Gaming and Streaming: Gamers on both platforms discuss the impact of 5G on low-latency gaming, with many using the internet for competitive esports.
How to Leverage Internet Usage for Your Benefit
The internet offers endless opportunities for personal and professional growth. Here are practical ways to use these statistics to your advantage:
- For Businesses:
- Target Mobile Users: With 54.67% of web traffic from mobile devices, optimize websites for mobile responsiveness to capture this audience.
- Leverage Social Media: With 5.41 billion social media users, platforms like Instagram and TikTok are ideal for targeted advertising, especially for younger demographics.
- Focus on Emerging Markets: Regions like South Asia and Africa, with growing internet penetration, offer untapped markets for e-commerce and digital services.
- For Individuals:
- Upskill Online: Use e-learning platforms to acquire new skills, capitalizing on the internet’s educational resources.
- Network Globally: Social media platforms connect you with professionals worldwide, enhancing career opportunities.
- Protect Your Privacy: Invest in VPNs and secure browsers to safeguard your data, especially with increased online time (6 hours 36 minutes daily).
- For Content Creators:
- Optimize for Search Engines: With 81.8% of users using search engines, incorporate keywords like “internet usage statistics 2025” to boost visibility.
- Engage on Social Media: Create short, engaging videos for platforms like TikTok, where 1.6 billion users are active.
- Analyze Trends: Use tools like Google Trends to identify what users are searching for, aligning content with current interests.
FAQs About Internet Usage Statistics
1. What is the global internet penetration rate in 2025?
The global internet penetration rate in 2025 is 67.9%, meaning nearly 68 out of every 100 people worldwide use the internet. This varies by region, with Northern Europe at 97.7% and Eastern Africa at 28.5%.
2. Which country has the most internet users in 2025?
China leads with 1.11 billion internet users, followed by India with 806 million and the United States with 332 million. China’s large population and infrastructure drive its dominance.
3. How much time do people spend online daily?
On average, people spend 6 hours and 36 minutes online daily, with 4 hours and 49 minutes on mobile devices. South Africans spend the most, averaging 9 hours and 37 minutes.
4. How can businesses benefit from internet usage trends?
Businesses can target mobile users, who account for 54.67% of web traffic, optimize for search engines like Google (with a 90.48% market share), and advertise on social media platforms with 5.41 billion users to reach diverse audiences.
5. What are the most popular devices for internet access?
Mobile phones are the most popular, used by 95.9% of internet users, followed by laptops or desktops (62.2%) and tablets (27.6%). Smartphones alone account for 93.7% of mobile access.
Also Read:
- Video Marketing Statistics
- Digital Marketing Statistics
- Affiliate Marketing Statistics
- X Twitter Statistics
- LinkedIn Statistics
Conclusion
In 2025, the internet connects 5.65 billion people, or 68.7% of the global population, with mobile devices driving 95.9% of access.
From China’s 1.11 billion users to Northern Europe’s 97.7% penetration rate, the digital world continues to expand. By understanding these trends—whether through regional data, device preferences, or social media engagement—you can harness the internet’s power for personal growth, business success, or creative expression.
Stay informed, optimize for mobile, and prioritize privacy to make the most of this digital era.