Amazon continues to be an unstoppable force, redefining how we shop, sell, and even power our digital world. If you want to leverage this powerhouse for your own benefit, understanding its latest statistics and trends is crucial.
As of 2025, Amazon not only dominates e-commerce and cloud computing but also offers incredible opportunities for sellers, advertisers, and anyone looking to understand the future of online business.
Let’s dive deep into the numbers shaping Amazon statistics and what they mean for you.
Amazon’s Unrivaled Market Share and Brand Value
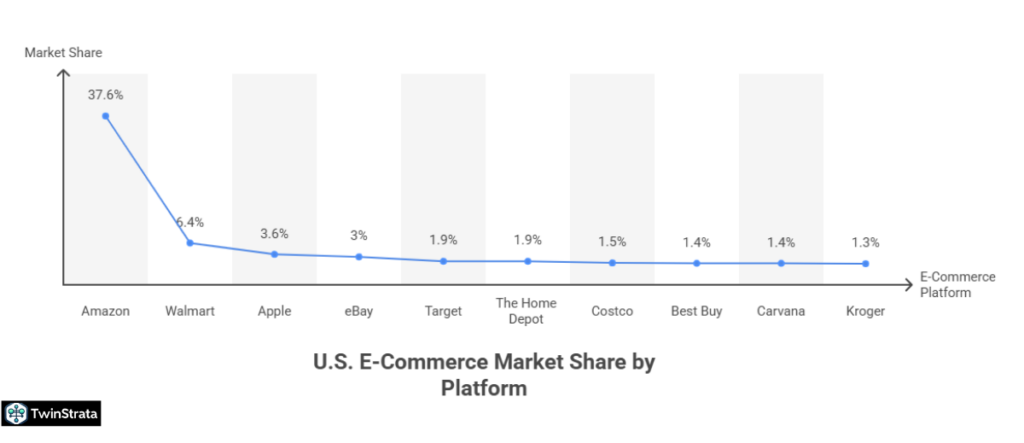
Amazon isn’t just a big player; it’s a market leader. In the U.S. e-commerce space, Amazon holds a staggering 37.6% market share, making it the undeniable leader. To put this in perspective, its closest competitors, like Walmart and Apple, hold significantly smaller shares.
Top E-commerce Platforms in the U.S. (2025)
| E-Commerce Platform | Percentage Of Market Share |
| Amazon | 37.6% |
| Walmart | 6.4% |
| Apple | 3.6% |
| eBay | 3% |
| Target | 1.9% |
| The Home Depot | 1.9% |
| Costco | 1.5% |
| Best Buy | 1.4% |
| Carvana | 1.4% |
| Kroger | 1.3% |
Source: Statista.
Beyond e-commerce, Amazon is also a global brand titan. It ranks as the 4th most valuable brand worldwide, with a brand value soaring to $356.4 billion in 2025. This immense brand power directly translates to customer trust and loyalty, giving sellers on the platform a significant advantage.
Most Valuable Brands in the World (2025)
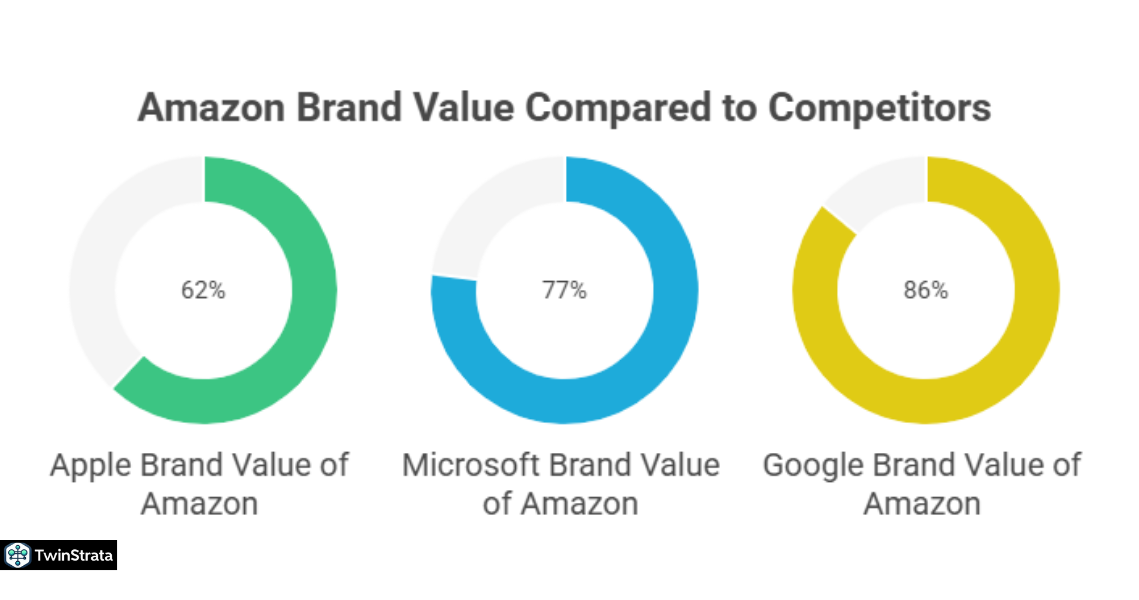
| Characteristic | Brand Value (in Billion USD) |
| Apple | 574.5 |
| Microsoft | 461.1 |
| 413.0 | |
| Amazon | 356.4 |
| Walmart | 137.2 |
| Samsung Group | 110.6 |
| TikTok/Douyin | 105.8 |
| 91.5 | |
| Nvidia | 87.9 |
| State Grid Corporation of China | 85.6 |
Source: Statista.
Amazon’s Revenue Streams: A Financial Juggernaut
Amazon’s financial performance in 2025 showcases robust growth across its diverse business segments. The company reported a net revenue of $167.7 billion in Q2 2025, marking a strong 13% year-over-year (YoY) increase. Its trailing twelve months (TTM) revenue hit an impressive $670 billion, growing 11% YoY.
Amazon’s Net Sales Revenue Over Recent Quarters
| Quarter | Net Sales Revenue |
| Q2 2025 | $167.7 billion |
| Q2 2024 | $148 billion |
| Q1 2023 | $127.4 billion |
| Q4 2022 | $149.2 billion |
| Q3 2022 | $127.1 billion |
| Q2 2022 | $121.23 billion |
| Q1 2022 | $116.44 billion |
| Q4 2021 | $137.41 billion |
| Q3 2021 | $110.81 billion |
| Q2 2021 | $113.08 billion |
| Q1 2021 | $108.52 billion |
| Q4 2020 | $125.56 billion |
| Q3 2020 | $96.15 billion |
| Q2 2020 | $88.91 billion |
| Q1 2020 | $75.45 billion |
- Also read about: What to Sell on Amazon FBA?
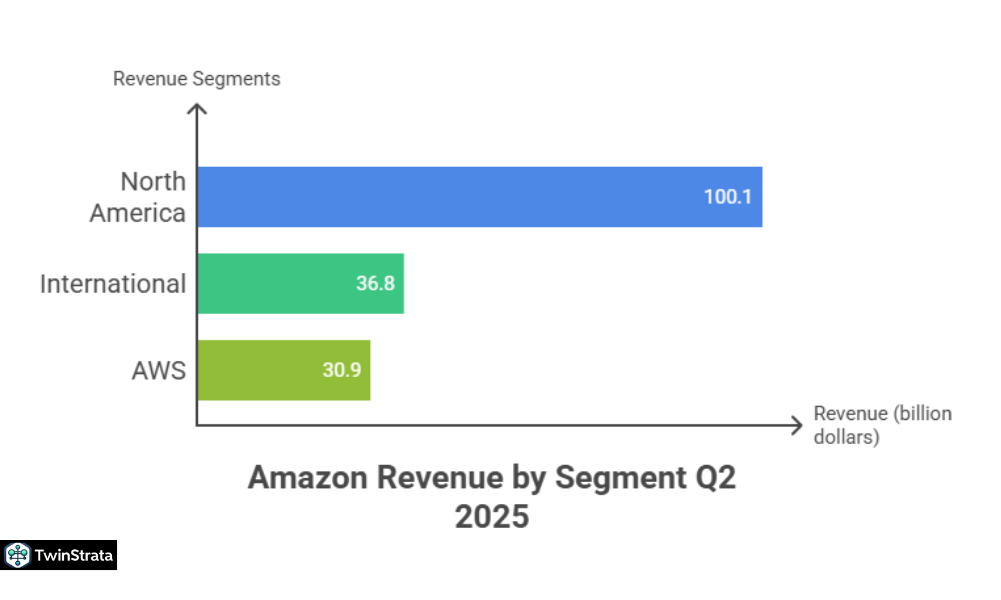
Revenue by Segment and Region: Where the Growth Happens
North America remains Amazon’s largest revenue contributor, generating $100.1 billion in Q2 2025 and accounting for 60% of total revenue. However, Amazon Web Services (AWS) demonstrates the highest growth.
Amazon Revenue by Segment in Q2 2025
| Segment | Q2 2025 Sales (B) | Q2 2024 Sales (B) | YoY Growth | Share of Total Revenue |
| North America | $100.1 | $90.0 | 11% | 60% |
| International | $36.8 | $31.7 | 16% | 22% |
| AWS | $30.9 | $26.3 | 17.5% | 18% |
Source: About Amazon
Online stores and third-party seller services continue their strong performance, while advertising services are seeing explosive growth.
Amazon Revenue by Business Line in Q2 2025
| Business Line | Q2 2025 (B) | Q2 2024 (B) | YoY Growth |
| Online Stores | $61.5 | $55.4 | 11% |
| Third-party Seller Services | $40.3 | $36.2 | 11% |
| AWS | $30.9 | $26.3 | 17% |
| Advertising Services | $15.7 | $12.8 | 23% |
| Subscription Services | $12.2 | $10.9 | 12% |
| Physical Stores | $5.6 | $5.2 | 7% |
| Other | $1.5 | $1.3 | 19% |
It’s clear that services, particularly AWS and advertising, are driving Amazon’s growth, with net service sales reaching $99.5 billion in Q2 2025, a 15% YoY increase. This indicates a strategic shift towards higher-margin service offerings.
Annual Revenue Milestones
Amazon’s revenue consistently climbs, hitting a peak of $513.98 billion in net sales in 2022. The company continues to show impressive annual growth, solidifying its position as an economic powerhouse.
Net Sales Revenue Generated by Amazon Over the Past Years
| Year | Net Revenue Generated By Amazon |
| 2022 | 513.98 billion |
| 2021 | 469.82 billion |
| 2020 | 386.06 billion |
| 2019 | 280.52 billion |
| 2018 | 232.89 billion |
| 2017 | 177.87 billion |
| 2016 | 135.99 billion |
| 2015 | 107.01 billion |
| 2014 | 88.99 billion |
| 2013 | 74.45 billion |
Amazon Traffic Statistics: Billions of Visits
Amazon.com remains one of the most visited websites globally, attracting 2.56 billion visits in 2025. It ranks #12 globally and #5 in the United States, cementing its role as a digital hub for consumers. A massive 67% of this traffic comes from direct visits, highlighting immense brand recognition and customer loyalty.
Top Traffic Sources to Amazon
| Source Type | Share (%) |
| Direct | 67.09% |
| Google (Organic) | 14.6% |
| YouTube | 1.21% |
| Bing | 1.09% |
Mobile users drive most of Amazon’s traffic (59.52%), and U.S. visitors account for over 83% of all visits, underscoring the platform’s dominant position in the American market.
Amazon Traffic by Country
| Country | Share (%) | Visits | Desktop (%) | Mobile (%) |
| United States | 83.12% | 2.13B | 38.68% | 61.32% |
| India | 1.91% | 48.83M | 30.36% | 69.64% |
| Canada | 0.86% | 21.94M | 48.52% | 51.48% |
| Brazil | 0.79% | 20.10M | 36.44% | 63.56% |
| Mexico | 0.75% | 19.15M | 30.24% | 69.76% |
How Many People Use Amazon? A Look at Its Massive User Base
Amazon’s user base is vast and continues to grow. Prime membership has exploded, going from 46 million users in 2016 to over 250 million in 2025 – a fivefold increase in just eight years! This shows the immense value customers find in the Prime ecosystem.
Amazon User Estimates for Key Services (2024–2025)
| Service Category | Users (2024–2025) |
| Amazon E-commerce | ~500 million |
| Amazon Prime | 250 million |
| Prime Video | 230 million |
| Prime Music | 75 million |
| AWS (Cloud Users) | ~10–15 million accounts |
| Kindle/E-book Users | ~50–70 million |
With 2.56 billion global visits, Amazon’s monthly active users likely range from 320 to 427 million. The United States alone accounts for 83% of this traffic, translating to 266 million to 355 million U.S. monthly users.
Amazon Sales Statistics: A Seller’s Paradise
Amazon hosts over 1.9 million selling partners worldwide. Importantly, third-party sellers are the backbone of Amazon’s marketplace, accounting for 62% of all products sold and 60% of all sales. This highlights the incredible opportunity for independent businesses on the platform.
Key Seller Metrics
- 1.9 million+ selling partners worldwide
- 62% of products sold come from third-party sellers
- 60% of all sales driven by third-party sellers
- 350+ million different products available in 2025
- Nearly 50% of U.S. sellers use Fulfillment by Amazon (FBA)
Amazon Prime Day: A Sales Extravaganza
Prime Day is no longer just a sales event; it’s a cultural phenomenon. In 2025, U.S. consumers spent a whopping $24.1 billion online during Prime Day, more than double Black Friday 2024 sales. Mobile shopping dominated, accounting for 53.2% of total online sales.
Interestingly, AI-powered tools saw a 3,300% YoY surge in traffic as consumers used chatbots to find deals, demonstrating the growing integration of AI in shopping habits. Influencer marketing also proved incredibly effective, driving 19.9% of total Amazon sales during this period and generating 10 times more sales than traditional social media marketing.
Deep Dive into Amazon’s Key Figures (2025)
Let’s explore some more in-depth statistics that paint a comprehensive picture of Amazon’s operations and financial health.
- Employees: Amazon employs approximately 1.56 million full-time and part-time workers globally as of Q1 2025.
- Total Net Sales: Amazon generated nearly $638 billion in global net sales revenue in its latest reports.
- FBA Usage: 50% of all units sold are distributed via Amazon’s FBA program, emphasizing its efficiency and popularity among sellers.
- Packages Shipped: Amazon ships over 1.6 million packages daily, processing almost 20 orders per second.
AWS Sales Revenue: The Cloud Powerhouse
Amazon Web Services (AWS) continues to be Amazon’s fastest-growing and most profitable segment. In Q2 2025, AWS generated $30.9 billion, showing a strong 17.5% YoY growth. This demonstrates the increasing reliance of businesses worldwide on Amazon’s robust cloud infrastructure.
AWS Net Sales Revenue Over Recent Quarters
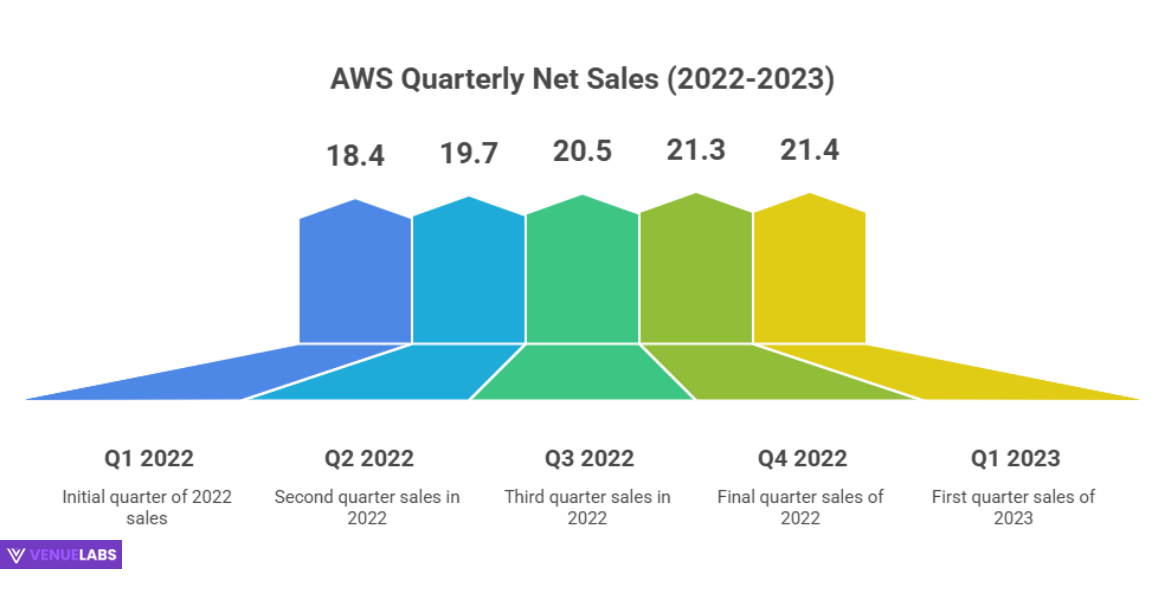
| Quarter | AWS Net Sales Revenue |
| Q2 2025 | $30.9 billion |
| Q1 2025 | $21.4 billion |
| Q4 2024 | $21.3 billion |
| Q3 2024 | $20.5 billion |
| Q2 2024 | $19.7 billion |
| Q1 2024 | $18.4 billion |
AWS’s Net Sales Revenue Over the Past Years
| Year | AWS’s Net Sales Revenue (Billions) |
| 2022 | 79.9 |
| 2021 | 62.1 |
| 2020 | 45.3 |
| 2019 | 35 |
| 2018 | 25.6 |
| 2017 | 17.4 |
| 2016 | 12.2 |
| 2015 | 7.8 |
| 2014 | 4.6 |
Amazon Subscription Revenue: Loyalty Pays Off
Amazon’s subscription services, primarily Amazon Prime, are a significant revenue driver, generating $35.2 billion in 2022. This consistent growth highlights the value proposition of Prime and other subscription offerings for customers.
Revenue Generated by Amazon Subscriptions Over the Past Years
| Year | Revenue Generated By Amazon Subscriptions (Billions) |
| 2022 | $35.2 |
| 2021 | $31.7 |
| 2020 | $25.2 |
| 2019 | $19.2 |
| 2018 | $14.1 |
| 2017 | $9.7 |
| 2016 | $6.3 |
| 2015 | $4.4 |
| 2014 | $2.7 |
Amazon Advertising Revenue: A Booming Business
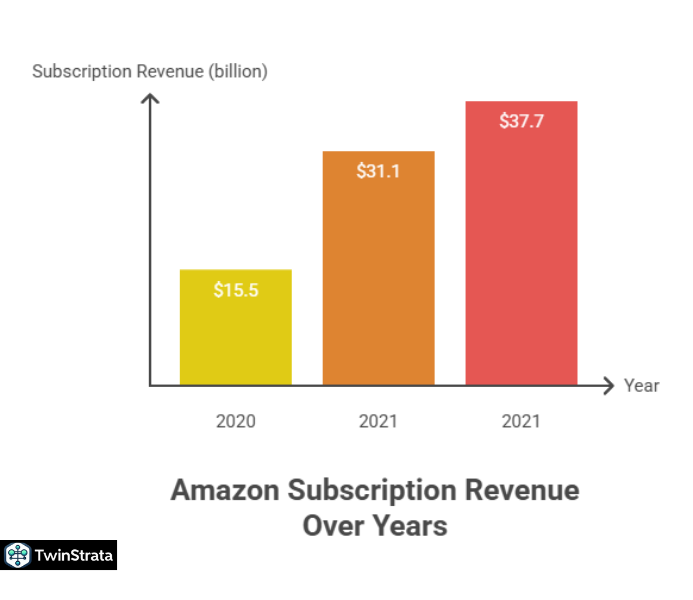
Amazon’s advertising platform is rapidly expanding, projected to hit $94 billion in global ad revenue by 2026, a massive leap from $37.74 billion in 2022. This shows the increasing effectiveness and popularity of Amazon Ads for sellers looking to boost product visibility.
Revenue Generated by Amazon Advertising Over the Past Years
| Year | Revenue Generated By Amazon Advertising (Billions) |
| 2022 | $37.7 |
| 2021 | $31.1 |
| 2020 | $15.5 |
Amazon’s Profit and Loss Analysis: A Story of Resilience
After a rare loss in 2022, Amazon made a dramatic recovery, achieving a record-breaking $59.2 billion profit in 2024 and significantly increasing its profit margins. In Q2 2025, Amazon reported a net income of $18.2 billion, a 35% increase YoY.
Profit Generated by Amazon in Recent Quarters
| Quarter | Profit Generated By Amazon (Millions) |
| Q1 2023 | 3,172 |
| Q4 2022 | 278 |
| Q3 2023 | 2,872 |
| Q2 2023 | -2,028 |
| Q1 2022 | -3,844 |
Amazon E-commerce Revenue: Still the Core
Despite the growth in services, e-commerce remains central to Amazon’s business. Excluding AWS, Amazon generated $147.9 billion in total e-commerce revenue in Q2 2025, reflecting a 21.5% YoY increase. The e-commerce segment accounted for 88.2% of Amazon’s total revenue in Q2 2025.
E-Commerce Net Sales of Amazon.com Over the Past Years
| Year | E-Commerce Net Sales of Amazon.com (Billions) |
| 2025 (Q2 only) | $147.9 |
| 2024 (estimated) | $520+ |
| 2022 | $142.43 |
| 2021 | $131.01 |
| 2020 | $120.90 |
| 2019 | $86.02 |
| 2018 | $74.53 |
| 2017 | $66.95 |
| 2016 | $56.45 |
| 2015 | $47.26 |
| 2014 | $39.30 |
Shipping and fulfillment costs continue to rise, but Amazon’s dominant U.S. e-commerce market share, standing at over 35%, proves its enduring strength.
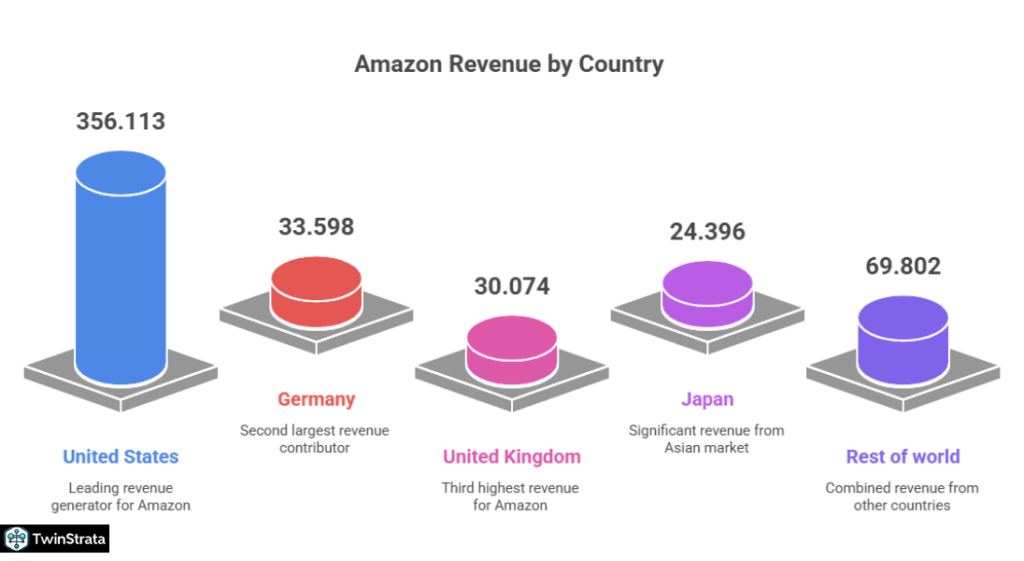
Amazon Revenue By Country: A Global Footprint
Amazon generates the highest net sales in the United States, followed by other major international markets. This highlights its global reach and varied revenue sources.
Net Sales Generated by Amazon Over the Past Years in Different Regions (Billions)
| Country | 2022 | 2021 | 2020 |
| United States | $356.113 | $314.006 | $263.520 |
| Germany | $33.598 | $37.326 | $29.565 |
| United Kingdom | $30.074 | $31.914 | $26.483 |
| Japan | $24.396 | $23.071 | $20.461 |
| Rest of world | $69.802 | $63.505 | $46.035 |
Amazon Physical Stores Vs. Online Stores: The Digital Dominance
Amazon’s online stores generate significantly more revenue than its physical stores. In Q2 2025, online store sales reached $61.485 billion, over 10 times the $5.595 billion from physical stores. This emphasizes Amazon’s core identity as a digital retail leader.
Amazon’s Online-to-Physical Revenue (Billions)
| Quarter | Online Stores | Physical Stores |
| Q1 2024 | $54.670 | $5.202 |
| Q2 2024 | $55.392 | $5.206 |
| Q3 2024 | $61.411 | $5.228 |
| Q4 2024 | $75.556 | $5.579 |
| Q1 2025 | $57.407 | $5.533 |
| Q2 2025 | $61.485 | $5.595 |
Amazon Acquisitions List: Strategic Expansion
Amazon has made 109 acquisitions as of 2025, strategically expanding its reach and capabilities. Notable acquisitions include Whole Foods for $13.7 billion and Metro-Goldwyn-Mayer for $8.45 billion.
Most Expensive Company Acquisitions by Amazon (Millions)
| Acquisition Made By Amazon | Year | Acquisition |
| Whole Foods | 2017 | 13,700 |
| Metro-Goldwyn-Mayer | 2021 | 8,450 |
| One Medical | 2022 | 3,900 |
| Zoox | 2020 | 1,300 |
| Zappos | 2009 | 1,200 |
| Ring | 2018 | 1,200 |
| Pillpack | 2018 | 1,000 |
| Twitch | 2014 | 970 |
| Kiva Systems | 2012 | 775 |
| Souq.com | 2017 | 580 |
| Quidsi | 2011 | 500 |
Amazon User Habits & Customer Behavior: Understanding Your Audience
Understanding how customers interact with Amazon is key for sellers. More than 65% of Amazon consumers shop through desktops, though mobile usage is on the rise.
Shopping Device Preference on Amazon
- Desktop: 64.9%
- Mobile Website: 16.6%
- Amazon Shopping App: 13.6%
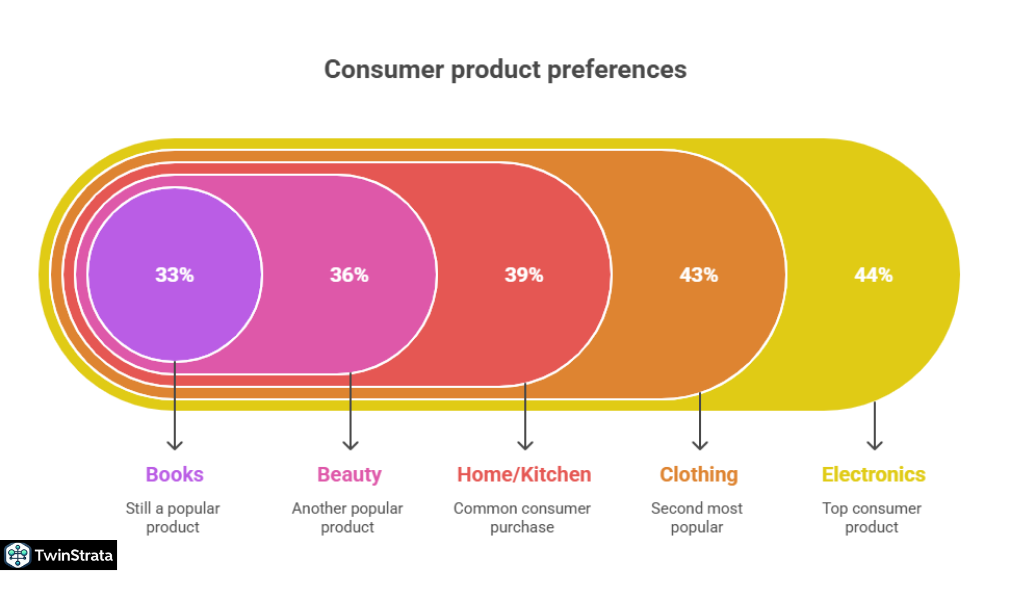
Electronics are the most frequently bought products, followed closely by clothing, shoes, and jewelry.
Most Frequently Bought Products from Amazon
| Products | Percentage Of Consumers |
| Electronics | 44% |
| Clothing, shoes, and jewelry | 43% |
| Home and Kitchen | 39% |
| Beauty and personal care | 36% |
| Books | 33% |
| Cell phones and accessories | 28% |
| Movie and TV | 25% |
| Pet supplies | 20% |
Fast and free shipping remains the top reason (80%) shoppers choose Amazon, followed by the desire to use Prime membership (66%) and wide product selection (69%).
Top Reasons Shoppers Prefer Amazon
| Reasons | Percentage Of Shoppers |
| Fast and free shipping | 80% |
| Desire to use Prime membership | 66% |
| Wide selection of products | 69% |
| Best prices on products | 49% |
| Easy returns | 44% |
A significant 66% of consumers start their product searches directly on Amazon, underscoring its role as a primary discovery platform.
Platforms Where Consumers Start New Product Searches
| Platform | Percentage Of Consumers |
| Amazon | 66% |
| Search Engine | 20% |
| Brand Website | 4% |
| Retailer Website | 4% |
| Other marketplaces | 3% |
| Social media | 1% |
| Other | 1% |
Beyond the Numbers: New Trends and Insights
Reddit and Quora discussions often reveal emerging trends and pain points for Amazon users and sellers. Here’s what people are talking about:
- AI Integration for Sellers: Many sellers are actively asking about how to leverage Amazon’s AI tools for listing optimization, inventory management, and even customer service. The data shows that 34% of Amazon sellers use AI for product listings, and this number is rapidly growing. Amazon itself is investing $25 million in AI research and utilizing over 750,000 robots in fulfillment centers to boost efficiency by 75%. The introduction of Rufus, an AI-powered shopping assistant, further highlights this trend, promising a more personalized shopping experience.
- Influencer Marketing Effectiveness: Queries on how to partner with influencers and measure ROI are common. The Prime Day 2025 statistics confirm the power of influencer marketing, driving 19.9% of total Amazon sales during the event and outperforming traditional social media by 10x. Sellers are keenly interested in understanding how to tap into this for their own growth.
- Sustainability Efforts: Consumers are increasingly conscious of environmental impact. Discussions on Amazon’s “Climate Pledge Friendly” program and its broader sustainability goals (like matching 100% of energy consumption with renewable sources in 2023) are frequent. This indicates that sellers focusing on eco-friendly products or practices might gain a competitive edge.
- “What’s the next big product to sell?” This is a perennial question. While no one has a crystal ball, observing top-performing categories like Beauty & Personal Care, Home & Kitchen, and Fashion & Accessories (especially with AI-powered tools identifying best-sellers like vegan eye patches and portable blenders) provides valuable guidance. The fastest-growing category is Fashion & Apparel, projected to grow by 12.4% by 2027.
- Logistics and Same-Day Delivery: Users are increasingly expecting faster delivery. Amazon’s continued investment in fulfillment centers (adding 16 million square feet in the U.S. in 2024) and achieving same-day delivery for over half of Prime orders addresses this demand. This level of logistical efficiency sets a high bar and creates pressure for third-party sellers to meet similar delivery speeds.
These insights from online communities highlight that Amazon is not just about raw numbers but also about evolving technology, consumer expectations, and strategic adaptation.
FAQs About Amazon Statistics
1. How large is Amazon's market share in U.S. e-commerce as of 2025?
As of 2025, Amazon holds a commanding 37.6% market share in the U.S. e-commerce industry, making it the leading platform by a significant margin.
2. Which Amazon segment generates the most revenue and which one is growing fastest?
Amazon’s North America segment generates the most revenue, contributing 60% of total revenue in Q2 2025. However, Amazon Web Services (AWS) is its fastest-growing venture, showing a 17.5% year-over-year increase in Q2 2025.
3. How many people are Amazon Prime members in 2025?
In 2025, Amazon Prime membership has surpassed 250 million globally, indicating a massive and loyal subscriber base that values the benefits offered by the program.
4. Why do most shoppers prefer Amazon over other platforms?
Most shoppers prefer Amazon primarily due to its fast and free shipping services (80%), their desire to utilize Prime membership benefits (66%), and the wide selection of products available on the platform (69%).
5. How is AI impacting Amazon's operations and seller experience in 2025?
AI is increasingly integral to Amazon’s operations, with over 750,000 robots boosting fulfillment efficiency by 75% and new tools like Rufus providing personalized shopping. For sellers, 34% now use AI for product listings, indicating growing adoption for streamlining business processes.
Also Read:
- WordPress Statistics
- Quora Statistics
- Threads Statistics
- YouTube Shorts Statistics
- LinkedIn Statistics
Conclusion: Amazon Continues Its Ascent
As of 2025, Amazon remains an unparalleled force in global e-commerce and cloud computing. Its dominant U.S. market share, massive revenue streams from diverse segments like AWS and advertising, and an ever-
expanding user base underscore its immense influence.
With over 250 million Prime members and billions of website visits, Amazon offers a fertile ground for businesses and individuals alike.
The company’s strategic acquisitions, relentless focus on customer satisfaction through fast shipping, and increasing integration of AI signal a future of continued innovation and growth.
For anyone looking to thrive in the digital economy, understanding and leveraging Amazon’s ecosystem is not just an advantage—it is essential.