Choosing between iPhone and Android in 2025? iPhone offers long software support and high resale value, while Android dominates with variety and budget options.
Android holds 72% of the global market, but iPhone leads in premium regions like the US.
This guide compares active users, app spending, and features, helping you choose based on your needs—whether it’s iPhone’s privacy tools or Android’s multitasking flexibility.
In 2025, Android outpaces iPhone in versatility, while iPhone excels in app revenue and ecosystem loyalty. Explore the latest trends to make an informed decision.
iPhone vs Android Market Share Worldwide in 2025

Android grabs 72.46% global share in July 2025, iOS 27.13%. You see Android’s lead from budget phones in Asia and Africa, where affordability wins.
iOS thrives in high-income areas with its premium appeal. Projections show Android at 75.18%, iOS 24.44% by year-end. Tablets flip: iOS 50.68%, Android 49.12%. You use iPad for creative work with Apple Pencil, or Android tablets for larger screens on a budget.
Market share table:
| Year | iOS (%) | Android (%) |
| 2020 | 26.28 | 73.06 |
| 2023 | 29.02 | 70.26 |
| 2024 | 27.81 | 71.56 |
| 2025 | 27.13 | 72.46 |
You target global ads to Android for reach, iOS for conversions.
iPhone vs Android Market Share in the US 2025
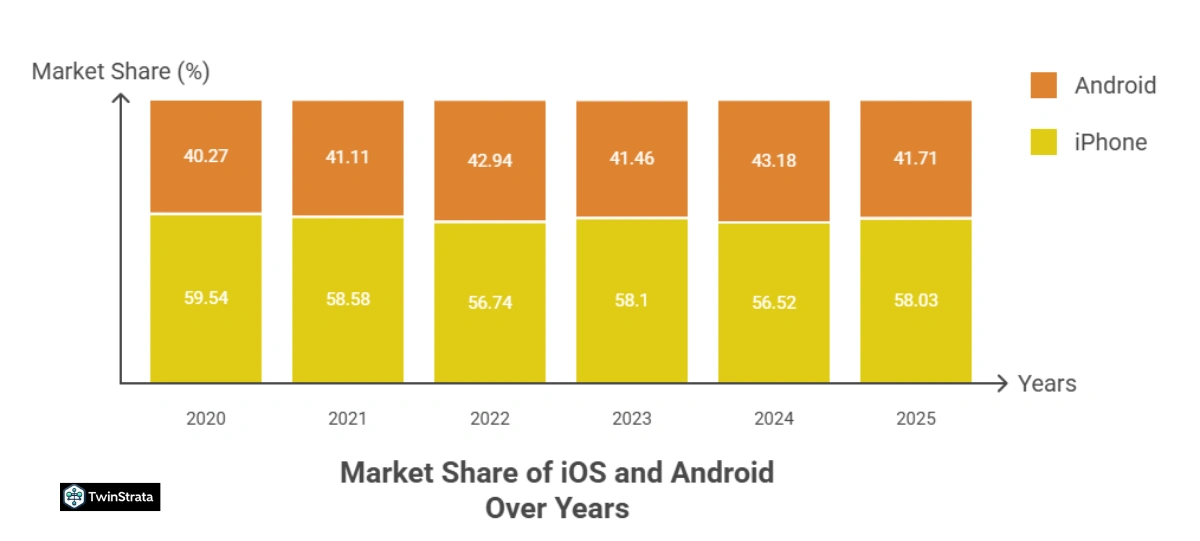
iOS leads US with 58.03-58.44% in 2025, Android 41.71-41.28%.
You prefer iPhone for carrier deals and trade-ins. 155 million iPhone users vs 133.4 million Android.
Tablets: iOS 54.74%, Android 45.09%.
US share table:
| Year | iOS (%) | Android (%) |
| 2020 | 59.54 | 40.27 |
| 2023 | 58.1 | 41.46 |
| 2024 | 56.52 | 43.18 |
| 2025 | 58.03 | 41.71 |
You optimize US apps for iOS first for higher engagement.
iPhone vs Android Users: Demographics and Habits
iPhone users skew younger and wealthier, spending $101/month on tech vs Android’s $50. 31% female iPhone vs balanced Android.
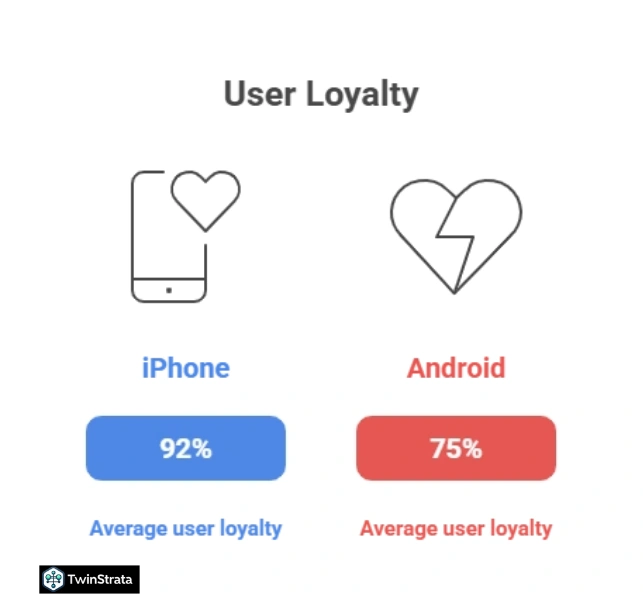
iPhone loyalty 90-94%, Android 70-80%. iPhone screen time 4.8 hours/day, Android 4.3; social media 2.6 vs 2.2 hours.
You build habits with iPhone’s Focus modes or Android’s custom launchers.
Demographics: iPhone younger (18-34), urban; Android diverse incomes. Reddit notes iOS apps better optimized, aiding younger users.
Loyalty table:
| Platform | Loyalty Rate (%) |
| iPhone | 90-94 |
| Android | 70-80 |
You leverage iPhone for premium marketing.
iPhone vs Android Smartphone Sales and Active Devices 2025
Apple ships 232.1 million iPhones in 2024, Samsung 223.4 million Android; 2025 projects 235 million iPhones. Active: 1.38-1.56 billion iPhones, 3-3.6 billion Android.
iPhone turnover 70% over 2 years, Android 57%. Best-sellers: iPhone 16 tops, Galaxy S25 Ultra Android star.
Sales table (Q2 2025):
| Vendor | Shipments (million) | Share (%) |
| Samsung | 58 | 19.7 |
| Apple | 46.4 | 15.7 |
You buy iPhone for longevity, Android for quick upgrades.
iPhone vs Android in Select Countries
US: iOS 47.5-58%, Android 52.2-41%. India: Android 96.67%. China: Android 77.44%, iOS 20.9%.
Japan: iOS 36.4-68.75%. You travel with eSIM—North America 50% adoption by end-2025, led by iPhone.
Country table:
| Country | iOS (%) | Android (%) |
| US | 47.5 | 52.2 |
| India | Low | 96.67 |
| China | 20.9 | 65.1-77.44 |
| Japan | 36.4 | 63.3 |
Tailor choices regionally.
Available Apps and Spending: iPhone vs Android
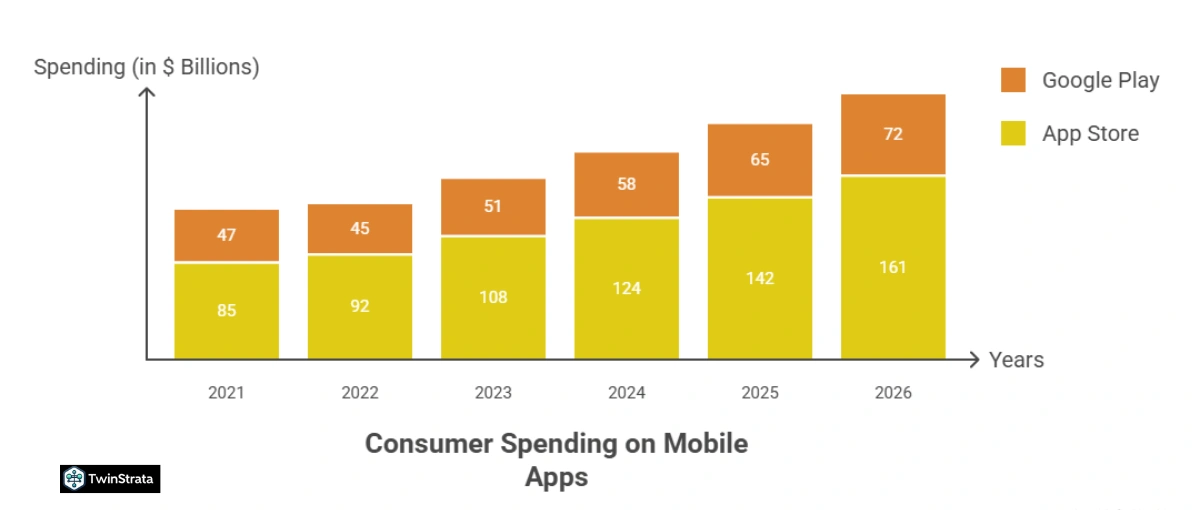
App Store: 1.55-1.9 million apps; Google Play: 1.68-2.44 million. Spending: iOS $142 billion, Android $65 billion; iOS 68.6% total.
iPhone $12.77/app vs Android $6.19; in-app $1.07 vs $0.43. You invest in iOS apps for higher returns.
Spending table:
| Year | App Store ($B) | Google Play ($B) |
| 2023 | 108 | 51 |
| 2024 | 124 | 58 |
| 2025 | 142 | 65 |
Latest Trends from Quora and Reddit: 2025 Insights
Quora users favor Android for versatility and price ranges, calling it better for 2025 reliability. Reddit debates iOS apps’ edge, but notes Android’s AI catching up.
Foldables boost Android; iPhone foldable eyed for 2026. Privacy pushes iPhone preference. You follow for switch tips.
FAQ About iPhone Vs Android Statistics
1. How do iPhone vs Android statistics 2025 help you choose a phone?
iPhone vs Android statistics 2025 guide you to select iPhone for US dominance and high app spending if you value premium features and loyalty, or Android for global reach and budget options that suit diverse needs like customization.
2. What trends do Reddit users discuss for iPhone vs Android in 2025?
Reddit users in 2025 praise iOS apps for better optimization and performance, but highlight Android’s AI advancements and versatility, with many considering switches for ecosystem benefits like smoother updates.
3. How has market share changed for iPhone vs Android in 2025?
Market share in 2025 sees Android at 72.46% globally versus iOS 27.13%, but iOS leads the US at 58.03%, reflecting regional preferences where iPhone thrives in premium markets and Android in emerging ones.
4. What demographics prefer iPhone over Android in 2025?
Demographics in 2025 show iPhone users as younger, wealthier, and more urban, spending twice as much on tech, while Android appeals to diverse incomes and older groups seeking affordability and variety.
5. How does app spending differ between iPhone and Android users in 2025?
App spending in 2025 reaches $142 billion for iPhone users versus $65 billion for Android, as iOS users average higher per-app costs due to premium habits and ecosystem loyalty.
Also Read:
- Latest Mobile Marketing Statistics
- Link Building Statistics
- Videogame Industry Statistics
- Online Advertising Statistics
- Live Streaming Statistics
Conclusion: Choose iPhone or Android Wisely in 2025
iPhone vs Android statistics 2025 show Android’s global dominance but iPhone’s US and revenue lead.
You gain from iPhone’s spending power and loyalty or Android’s affordability.
Pick based on needs—iPhone for security, Android for choice.
Source: Statista, Exploding Topics