Screens are now deeply woven into everyday life. People rely on them for work, education, entertainment, shopping, and staying in touch with others.
Smartphones, laptops, tablets, and TVs help us stay productive and connected—but they also increase the risk of overuse.
Average screen time statistics 2025 clearly show how much time people spend in front of screens and why managing digital habits is more important than ever.
Globally, people spend 6 hours and 45 minutes per day on screens. In the United States, adults average 7 hours and 2 minutes daily, while teenagers often exceed 8 hours a day.
This guide explains screen time trends in 2025 using easy language and real data. You will learn how screen time differs by age, country, device, and activity, and how to build healthier digital habits without giving up technology completely.
Global Screen Time Trends in 2026
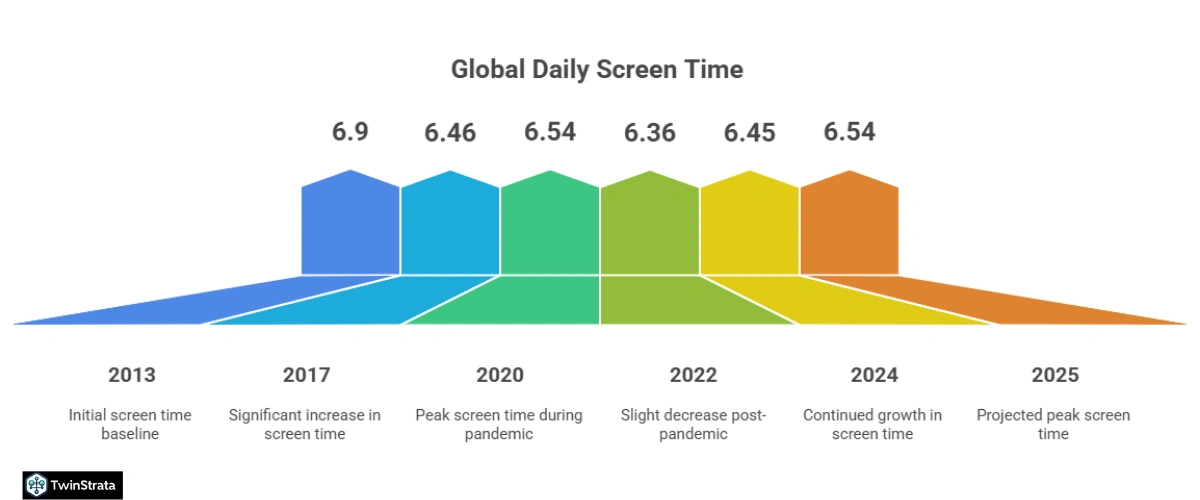
Worldwide screen time continues to rise steadily. In 2025, the global daily average is 6 hours and 45 minutes, which equals 47 hours and 15 minutes per week.
Experts expect this figure to increase slightly to 6 hours and 54 minutes by the end of Q3 2025.
Although adult screen time dropped a bit after the pandemic, long-term trends still show growth.
Smartphones, streaming platforms, social media, and remote work are the main reasons for this increase.
Global Screen Time Over the Years
| Year (Q3) | Avg Daily Screen Time | Change |
| 2013 | 6h 9m | – |
| 2017 | 6h 46m | +4.3% |
| 2020 | 6h 54m | +4.2% |
| 2022 | 6h 36m | -5.1% |
| 2024 | 6h 45m | +1.25% |
| 2025* | 6h 54m | +2.22% |
*Projected
What this means for you:
If your daily screen time is much higher than the global average, small changes—such as limiting phone use at night or during meals—can improve focus, sleep, and well-being.
Also read about: Apple Statistics
Screen Time in the United States
Adults in the United States spend about 7 hours and 2 minutes per day on screens. This number has remained mostly stable since 2021.
Total media use in the U.S. equals 59 hours and 56 minutes per week, or 8 hours and 34 minutes per day, when TV, mobile phones, computers, and apps are combined.
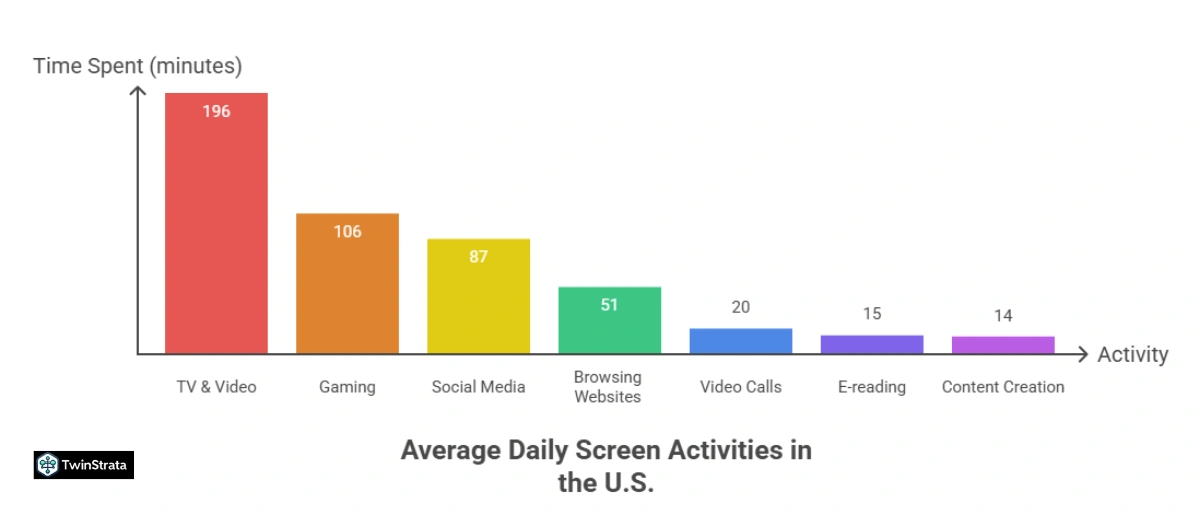
Daily Screen Activities of U.S. Adults
| Activity | Time Spent |
| Watching TV & Videos | 3h 16m |
| Gaming | 1h 46m |
| Social Media | 1h 27m |
| Browsing Websites | 51m |
| Video Calls | 20m |
| E-reading | 15m |
| Content Creation | 14m |
Helpful tip:
You don’t need to cut screens completely. Replacing some entertainment time with learning apps, podcasts, or educational videos can improve productivity while keeping screen time useful.
Also read about: Android Statistics
Screen Time by Age and Gender
Younger people spend the most time on screens, while older adults spend much less. Gen Z clearly leads all age groups.
Daily Screen Time by Age and Gender
| Age Group | Female | Male |
| 16–24 | 7h 35m | 7h 11m |
| 25–34 | 7h 17m | 7h 13m |
| 35–44 | 6h 43m | 6h 37m |
| 45–54 | 6h 7m | 6h 4m |
| 55–64 | 5h 18m | 5h 21m |
| 65+ | 4h 7m | 3h 59m |
Screen Time by Generation
| Generation | Avg Daily Screen Time |
| Gen Z | 9 hours |
| Millennials | 6h 42m |
| Gen X | 4h 10m |
| Baby Boomers | 3h 31m |
Key insight:
Many Gen Z users say they overuse smartphones. Simple tools like screen-time reminders, focus apps, and blue-light filters can reduce eye strain and improve sleep quality.
Also read about: Videogame Industry Statistics
Countries with the Highest Screen Time
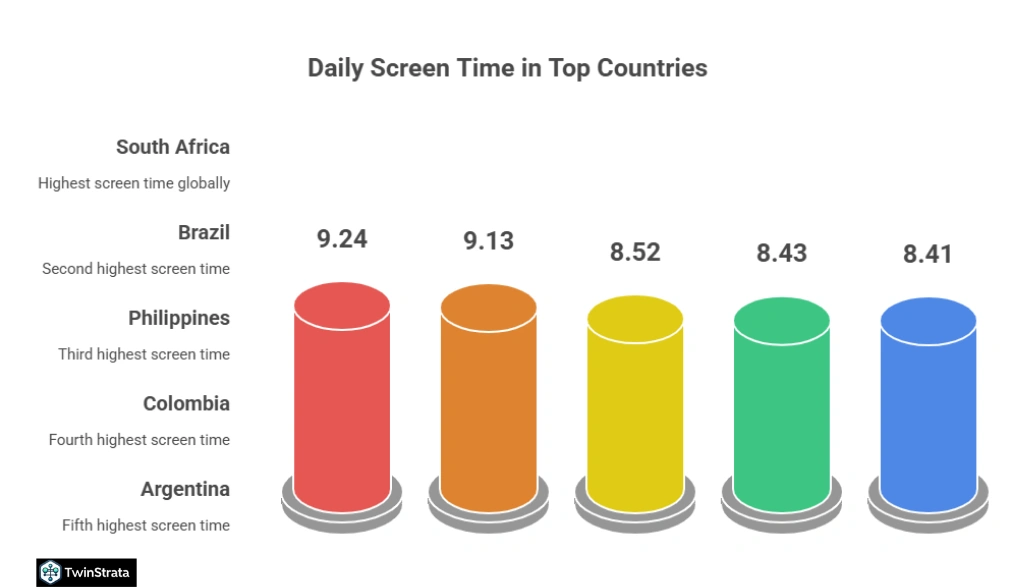
Screen habits vary widely across countries due to lifestyle, internet access, and culture.
Top Countries by Daily Screen Time
| Rank | Country | Time |
| 1 | South Africa | 9h 24m |
| 2 | Brazil | 9h 13m |
| 3 | Philippines | 8h 52m |
| 4 | Colombia | 8h 43m |
| 5 | Argentina | 8h 41m |
Japan records the lowest screen time globally at 4 hours and 9 minutes per day.
Takeaway:
Countries with lower screen time often focus more on outdoor activities, social interaction, and offline hobbies. Adding walks, sports, or creative activities to your routine can help reduce screen overload.
Device Usage in 2025: Mobile Comes First
Smartphone Screen Time
Smartphones account for 53% of total screen time worldwide. On average, people spend 4 hours and 37 minutes per day on their phones.
| Country | Daily Smartphone Use |
| Ghana | 5h 43m |
| Philippines | 5h 21m |
| Brazil | 5h 12m |
Smart habit:
Review your most-used apps weekly and remove or limit those that don’t add value.
Computer and Desktop Screen Time
Computers make up 47% of total screen time, with a global average of 3 hours and 14 minutes per day.
South Africa leads desktop usage with 5 hours and 37 minutes daily.
Streaming and Social Media Usage
Streaming Time in the U.S.
| Platform | Daily Time |
| Hulu | 2h 10m |
| Netflix | 1h 50m |
| Amazon Prime | 1h 37m |
| Disney+ | 1h 29m |
Social Media Screen Time
Globally, users spend 2 hours and 31 minutes per day on social media in 2025.
TikTok leads all platforms, with users averaging 1.5 hours daily.
Balance tip:
Setting daily limits on social apps can free up time for sleep, reading, or exercise without cutting social connection entirely.
Children and Screen Time in 2025
Children are exposed to screens earlier than ever.
- 74% of U.S. parents say their 2-year-olds watch TV
- Tweens (8–12 years): 5h 33m per day
- Teens: 8h 39m per day
Children’s App Usage
| App | Time |
| TikTok | 1h 53m |
| Snapchat | 1h 30m |
| 20m |
Parental Screen Rules
| Rule Type | % of Parents |
| No limits | 40% |
| Daily limits | 27% |
| Weekends only | 29% |
| No use allowed | 4% |
Parent tip:
Creating family screen rules—like no screens during meals or before bedtime—helps children build healthier habits.
Health Risks Linked to Excessive Screen Time
Too much screen time is linked to several health issues.
Health Risks Associated with Excess Screen Use
| Condition | Linked Risk |
| Obesity | 23% |
| Type 2 Diabetes | 15% |
| Heart Disease | 12% |
| Sleep Issues | High |
| Depression | 6% |
Medical guidance:
- Adults: Maximum 2 hours of leisure screen time per day
- Children under 2: No screen time
Despite this, 87% of children exceed recommended limits.
Practical Ways to Manage Screen Time Better
You don’t need to quit screens to live healthier. Small, smart changes make a big impact.
Simple Screen-Time Management Tips
- Track weekly screen usage
- Set daily app limits
- Use night mode and blue-light filters
- Create screen-free zones at home
- Replace scrolling with learning apps or audiobooks
- Join online challenges for motivation
FAQs About Screen Time Statistics
1. What is the global average screen time in 2025?
About 6 hours and 45 minutes per day worldwide.
2. Which age group spends the most time on screens?
Gen Z, averaging 9 hours daily.
3. Which country has the highest screen time?
South Africa, with 9 hours and 24 minutes per day.
4. What are the main health risks of excessive screen time?
Obesity, sleep problems, diabetes, and mental health issues.
5. How can I reduce screen time easily?
Use tracking apps, set daily limits, and add screen-free activities like walking, reading, or hobbies.
Also Read:
- Google Ads Statistics
- Online Advertising Statistics
- Character AI Statistics
- AI Trends Statistics
- Metaverse Statistics
Final Thoughts: Building Healthier Digital Habits
Average screen time statistics 2025 show a world that is deeply connected to digital devices. With people spending 6 hours and 45 minutes per day on screens, balance—not avoidance—is the key.
While excessive screen time can harm sleep, physical health, and mental well-being, mindful use can turn screens into powerful tools for learning, creativity, and connection.
By tracking your habits, setting limits, and choosing better content, you can create a healthier relationship with technology—one that supports your goals, relationships, and quality of life.
Source: Exploding Topics, Statista