Android dominates the mobile world in 2025. With billions of users and a vast global market share, Android shapes how we connect, work, and play.
If you want to understand the current mobile landscape, harness the power of app development, or simply get the most out of your device, these android statistics are for you.
We are diving deep into Android’s impressive reach, its competition with iOS, and the trends that are setting the stage for the future.
Android’s Unrivaled Dominance: Billions and Growing
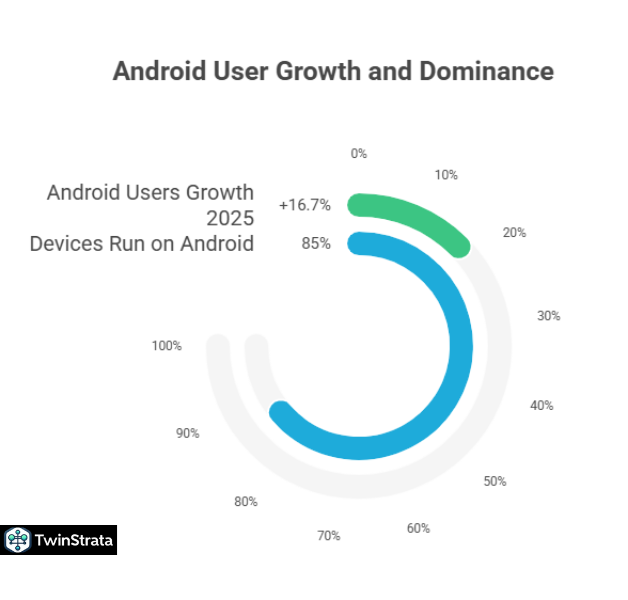
Imagine a world where one operating system connects most of humanity. That’s the reality with Android in 2025. This powerful, flexible operating system has reached an astounding 3.6 billion users worldwide.
This number isn’t just a statistic; it represents billions of daily interactions, countless apps downloaded, and a global ecosystem that continues to expand.
Android’s journey to this point has been remarkable. Launched in 2008, it quickly gained momentum, surpassing 1 billion users by 2014, just three years after its widespread rollout in 2011. Since then, its growth has been consistent and impressive.
How Many People Use Android?
More than 3.6 billion individuals actively use Android devices today. This makes it, by far, the most popular mobile operating system on the planet.
Let’s look at this incredible growth trajectory:
| Year | Number Of Android Users Worldwide (Billions) |
| 2012 | 0.5 |
| 2013 | 0.7 |
| 2014 | 1 |
| 2015 | 1.4 |
| 2016 | 1.7 |
| 2017 | 2 |
| 2018 | 2.3 |
| 2019 | 2.5 |
| 2020 | 2.8 |
| 2021 | 3 |
| 2022 | 3.3 |
| 2023 | 3.5 |
| 2024 | 3.6 |
Source: Business of Apps
Android captured the hearts and hands of users worldwide, officially becoming the most popular mobile OS in 2014. It rapidly scaled its user base, demonstrating its appeal across diverse demographics and regions.
- Also read about: iPhone Users Statistics
Android’s Global Market Share: The Undisputed Leader
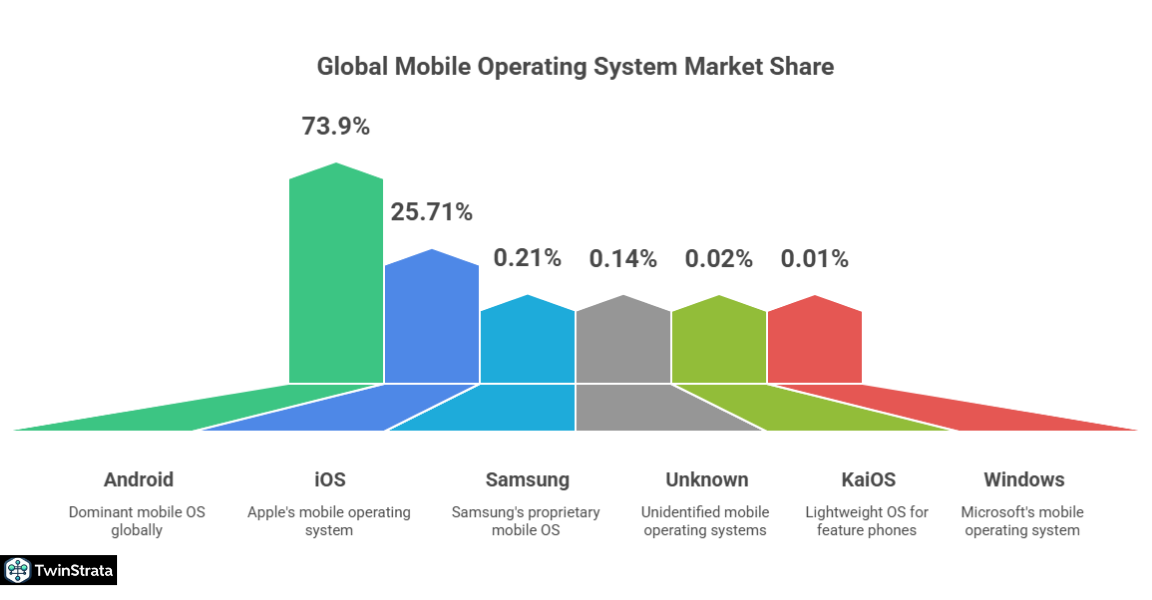
When we talk about global market share, Android is the clear leader. A staggering 73.9% of all mobile phones currently use the Android operating system. This means that for every four smartphones in use globally, nearly three run on Android.
Here’s how Android stacks up against other mobile operating systems:
| Operating System | Percentage Of Mobile Devices |
| Android | 73.9% |
| iOS | 25.71% |
| Samsung | 0.21% |
| Unknown | 0.14% |
| KaiOS | 0.02% |
| Windows | 0.01% |
Android doesn’t just dominate globally; it achieves exceptional market penetration in specific regions. In countries like India, Brazil, Indonesia, Vietnam, and Turkey, Android commands an incredible market share of over 85%.
This reflects its accessibility, diverse device offerings, and suitability for a wide range of user needs and economic conditions.
Android vs. iOS: The Global Showdown
While Android holds the overall majority, the competition with Apple’s iOS is a continuous story. Globally, Android claims a 73.9% share of the mobile operating system market in 2025, while iOS holds 25.71%.
Let’s look at the market share evolution over the years:
| Year | Android | iPhone (iOS) |
| 2017 | 72.63% | 19.65% |
| 2018 | 75.45% | 20.47% |
| 2019 | 75.47% | 22.71% |
| 2020 | 73.06% | 26.28% |
| 2021 | 71.89% | 27.34% |
| 2022 | 71.47% | 27.85% |
| 2023 | 70.26% | 29.02% |
| 2024 | 71.85% | 27.6% |
| 2025 | 73.9% | 25.71% |
Source: Statista
(Note: Some sources provide slightly different figures for 2025 market share, reflecting dynamic shifts. For instance, another reliable source indicates Android at 72.46% and iPhone (iOS) at 27.13% as of July 2025. These minor variations highlight the ongoing, fluid nature of market share analysis.)
The US Market: A Different Picture
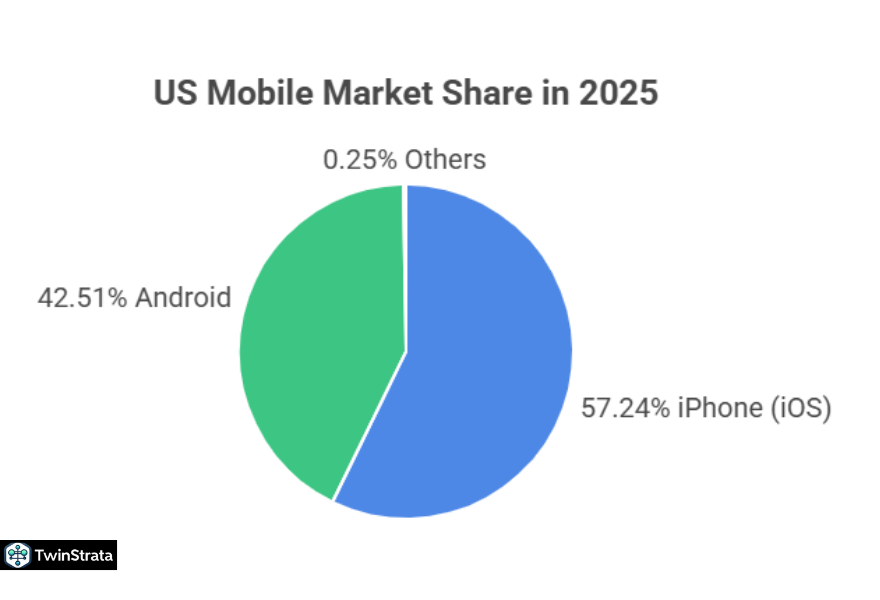
The competitive landscape shifts considerably when we focus on the United States. Here, iPhones actually lead the mobile market. In 2025, iPhones hold a market share of 57.24%, while Android devices account for 42.51%.
This makes the US market a strong outlier compared to global trends, showcasing Apple’s particular strength in its home country.
Here is the breakdown of the US market share:
| Year | Android | iPhone (iOS) |
| 2016 | 45.2% | 53.19% |
| 2017 | 45.23% | 53.89% |
| 2018 | 44.73% | 54.82% |
| 2019 | 44.51% | 55.23% |
| 2020 | 40.27% | 59.54% |
| 2021 | 41.11% | 58.58% |
| 2022 | 42.94% | 56.74% |
| 2023 | 41.46% | 58.1% |
| 2024 | 42.34% | 57.39% |
| 2025 | 42.51% | 57.24% |
(Again, some variations exist, with another source showing iPhone at 58.03% and Android at 41.71% in the US for 2025, as of July. These minor differences are normal in market analysis and reflect ongoing shifts.)
Despite Apple’s dominance in the US, an estimated 133.4 million individuals in the US own an Android smartphone, compared to 118.1 million iPhone users (as of 2022 data). This indicates a large and vibrant Android user base even where iOS leads in market share percentage.
Android Version Adoption: Staying Current
Keeping up with the latest Android versions is crucial for security and new features. In 2025, Android 14 takes the lead, dominating 24.51% of the Android version market share.
This shows a healthy rate of adoption for the newest operating system release, which brings enhanced privacy, improved performance, and new personalization options to users.
Leading the Hardware Game: Android Vendors
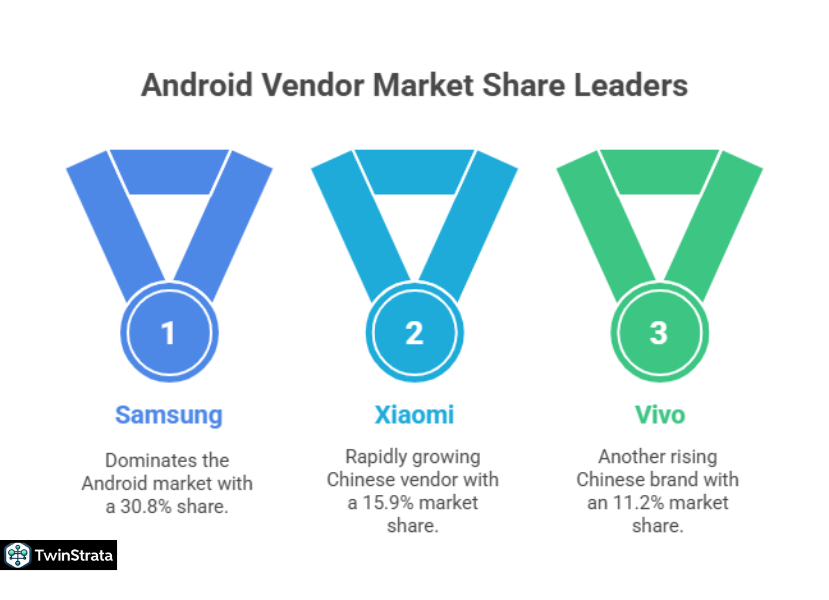
One of Android’s greatest strengths is its open nature, allowing many manufacturers to create devices. Among these, Samsung stands out as the undisputed leader in the Android vendor market, commanding a significant 30.8% market share worldwide.
Samsung’s consistent innovation, diverse product range, and strong brand presence help it capture a substantial portion of the Android ecosystem.
Following Samsung, Chinese manufacturers like Xiaomi, Vivo, and Oppo continue to gain ground, reflecting their growing influence in the global smartphone market.
Here is a detailed look at the Android vendor market share:
| Company | Market Share |
| Samsung | 30.8% |
| Xiaomi | 15.9% |
| Vivo | 11.2% |
| Oppo | 10.1% |
| Realme | 5.2% |
| Honor | 3.3% |
| Infinix | 3.2% |
| Amazon | 3.1% |
| Huawei | 2.8% |
| Tecno | 2.7% |
| Motorola | 2.3% |
| Others | 9.4% |
The App Ecosystem: A Universe of Choices
The Google Play Store is a digital treasure trove, offering millions of applications that extend the functionality of Android devices in countless ways. As of Q2 2025, the Google Play Store hosts an impressive 2.06 million apps. This vast selection provides users with unparalleled choice, catering to every interest and need.
Let’s track the growth of apps on the Google Play Store:
| Month, Year | Number of Apps On Google Play Store |
| Q2 2022 | 2,654,747 |
| Q3 2022 | 2,683,925 |
| Q4 2022 | 2,694,114 |
| Q1 2023 | 2,673,292 |
| Q2 2023 | 2,597,819 |
| Q3 2023 | 2,593,870 |
| Q4 2023 | 2,438,553 |
| Q1 2024 | 2,000,247 |
| Q2 2024 | 1,682,635 |
| Q2 2025 | 2,066,588 |
(Note: There appears to be a notable fluctuation in app numbers from Q4 2023 to Q2 2024. This could indicate stricter app review processes, removal of outdated or low-quality apps, or a re-categorization by data providers, leading to a leaner but potentially higher-quality app store by 2025.)
The Most Popular Android Apps
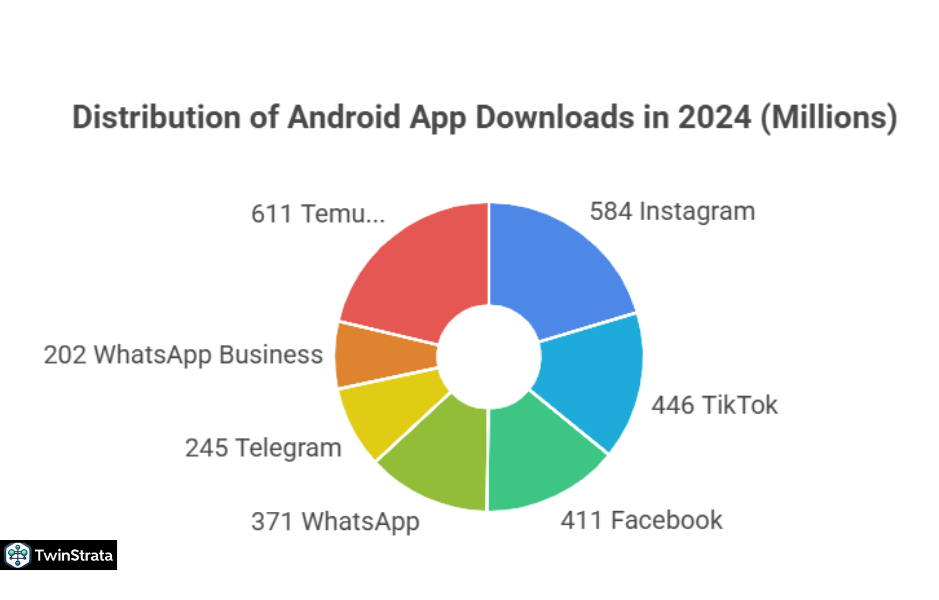
Among the millions of choices, some apps capture the global imagination more than others. In 2024, Instagram leads as the most downloaded app worldwide on Android, with a staggering 584 million downloads.
TikTok and Facebook follow closely, demonstrating the continued dominance of social media and entertainment platforms.
Here are the top leading Android apps by downloads as of December 2024:
| Application | Number Of Application Downloads |
| 584 million | |
| TikTok | 446 million |
| 411 million | |
| 371 million | |
| Telegram | 245 million |
| WhatsApp Business | 202 million |
| Temu | 191 million |
| Snapchat | 154 million |
| Threads | 136 million |
| CapCut | 130 million |
These apps shape daily communication, content consumption, and e-commerce for billions of Android users.
App Spending: iPhone Users Lead
While Android boasts more users and more apps, iPhone users historically spend more on mobile applications. Consumer spending on the App Store (for iPhone users) is forecasted to reach an impressive 65 billion in app spending. This means iPhone users account for about 68.6% of all consumer spending on mobile apps, with Android making up 31.4%.
This trend highlights differences in user demographics, monetization strategies, and potentially higher disposable income among iPhone users. For app developers, understanding this dynamic is crucial for their business models.
Here’s the detailed breakdown of consumer spending on mobile apps:
| Year | App Store (iPhone) Spending (Billions) | Google Play (Android) Spending (Billions) |
| 2021 | $85 | $47 |
| 2022 | $92 | $45 |
| 2023 | $108 | $51 |
| 2024 | $124 | $58 |
| 2025 | $142 | $65 |
| 2026 | $161 | $72 |
Best-Selling Smartphones: A Mixed Bag
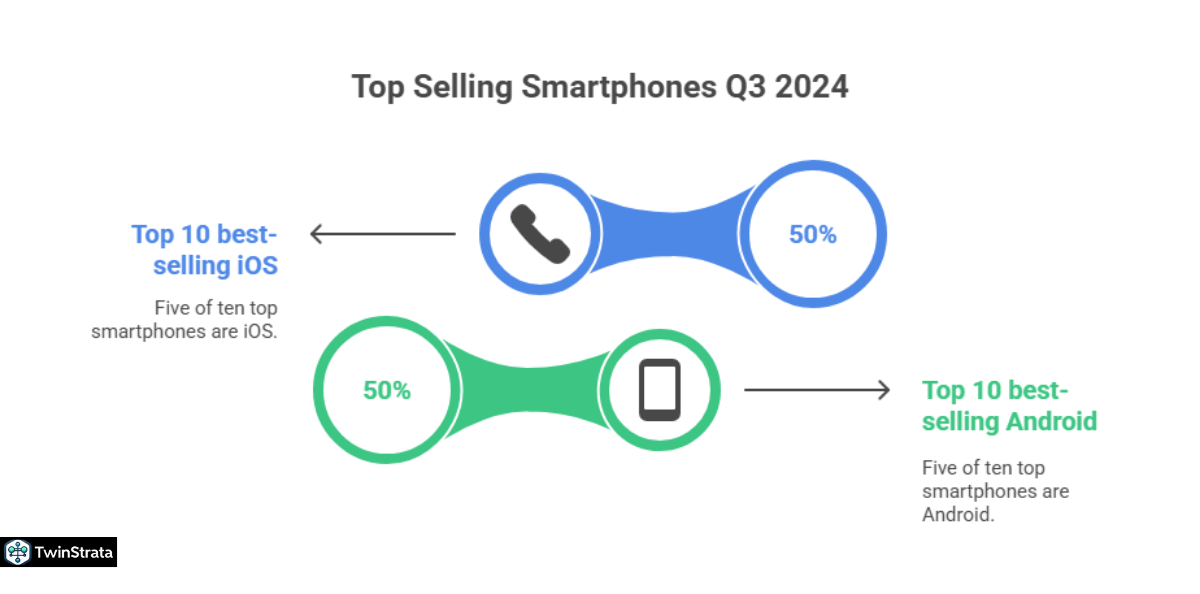
When it comes to the best-selling smartphone models, the market shows a healthy mix of both iOS and Android devices.
As of Q3 2024, Counterpoint Research indicates that 5 of the top 10 best-selling smartphones worldwide are iPhone models operating on iOS, while the other 5 are Samsung and Xiaomi smartphones running on the Android operating system.
This suggests that while Android holds the market share for the OS, Apple’s individual device models are exceptionally popular.
Here’s a list of best-selling smartphones by operating system:
| Smartphone, Rank | Operating System |
| 1. iPhone 16 | iOS |
| 2. iPhone 16 Pro Max | iOS |
| 3. iPhone 16 Pro | iOS |
| 4. iPhone 15 | iOS |
| 5. Galaxy A16 5G | Android |
| 6. Galaxy A06 | Android |
| 7. Galaxy S25 Ultra | Android |
| 8. Redmi 14C 4G | Android |
| 9. Galaxy A55 5G | Android |
| 10. iPhone 16 Plus | iOS |
This list shows that both premium flagship devices (like the iPhone Pro Max and Galaxy S25 Ultra) and more affordable, mid-range options (like the Galaxy A series and Redmi) resonate with consumers.
What’s New? Android Trends from Quora and Reddit
Beyond the numbers, people constantly ask practical questions about Android usage. Here are some emerging themes and common concerns from communities like Quora and Reddit, giving us a pulse on current user priorities:
- Battery Life Optimization (Still a Big One!): Users constantly seek tips for extending battery life, especially with new Android versions and demanding apps. Discussions often revolve around background app restrictions, dark mode usage, and analyzing battery usage statistics to identify power-hungry apps.
- Privacy Controls and Permissions: With increasing awareness around data privacy, users actively discuss how to manage app permissions, understand Android’s privacy dashboard, and secure their personal information on their devices. Questions often arise about specific app permissions and how to revoke them effectively.
- Customization Beyond the Basics: While Android is known for customization, users now look for deeper options. This includes discussions on custom launchers (like Nova Launcher or Action Launcher), icon packs, unique widgets, and even advanced theming capabilities, going beyond what stock Android offers. They want their phones to truly reflect their personality.
- Integration with Smart Home Devices: As smart homes become more prevalent, Android users are keen to understand and optimize their phone’s integration with devices like smart speakers, lights, and thermostats. They seek seamless control and automation, often discussing the best apps and routines for managing their connected ecosystems.
- AI Features and Productivity: The rise of on-device AI features, such as advanced photo editing, smarter notifications, and integrated AI assistants, generates significant interest. Users ask how to leverage these tools for increased productivity, better organization, and more intuitive device interaction. They want to know how these AI enhancements can genuinely improve their daily lives.
- Cross-Device Continuity (Android Ecosystem): Users increasingly want seamless transitions between their Android phone, tablet, smartwatch, and even Windows PCs. Discussions center on features like Nearby Share, Quick Share, improved syncing for notifications and messages, and app continuity across different form factors.
These insights show that while statistics paint a broad picture, the everyday concerns and aspirations of Android users revolve around practical enhancements, personalized experiences, and powerful integration.
FAQs About Android Statistics
1. How many active Android users are there in 2025?
There are more than 3.6 billion active Android users worldwide in 2025, solidifying its position as the most widely used mobile operating system globally.
2. What is Android's global market share compared to iOS in 2025?
Android commands a significant 73.9% of the global mobile operating system market share in 2025, while iOS holds 25.71%, indicating Android’s continued dominance.
3. Which Android version is most popular in 2025?
Android 14 currently leads in terms of usage, holding 24.51% of the Android version market share in 2025, reflecting strong adoption of the latest operating system features.
4. Which company is the top Android smartphone vendor in 2025?
Samsung remains the leading Android vendor worldwide in 2025, capturing an impressive 30.8% of the mobile vendor market share.
5. How many apps are available on the Google Play Store in 2025?
As of Q2 2025, the Google Play Store offers over 2.06 million apps, providing a vast and diverse selection for Android users around the world.
Also Read:
- Gmail Statistics
- Linkedin Statistics
- Mobile Internet Traffic Statistics
- WordPress Statistics
- Quora Statistics
Conclusion: Android Continues to Shape Our Digital Lives
Android undeniably continues to dominate mobile usage in 2025. With its massive user base of 3.6 billion individuals and a commanding 73.9% global market share, it remains the most widespread mobile operating system worldwide.
While facing strong competition from iOS in key markets like the US, Android’s reach in emerging economies, where it often exceeds an 85% market share, solidifies its global leadership.
Samsung continues to lead the pack among Android device manufacturers, consistently delivering popular and innovative smartphones. The vibrant Google Play Store, housing over 2.06 million apps, ensures that Android users have an unparalleled selection of tools and entertainment at their fingertips, with social media giants like Instagram and TikTok leading download charts.
Android’s journey from its early days in 2012 to its current status as a global powerhouse highlights its adaptability, accessibility, and continuous innovation.
As new app numbers grow, user engagement deepens, and new AI-powered features emerge, Android maintains its position at the forefront of the smartphone ecosystem, constantly evolving to meet the demands of a connected world. It will be exciting to witness how Android further shapes our future interactions and digital experiences.