Black Friday kicks off the holiday shopping rush each year, drawing millions of eager buyers hunting for deals. In 2025, experts predict even bigger numbers as online shopping surges and AI shapes how people buy.
Projections show U.S. online spending hitting $12 to $12.5 billion on Black Friday alone, while global figures climb to $80 to $82 billion. This marks a potential 10-15% jump from 2024’s $10.8 billion in the U.S. and $74.4 billion worldwide.
Shoppers favor mobile devices more than ever, with 73% of purchases expected on phones. Buy Now, Pay Later (BNPL) options grow popular, helping buyers spread costs amid rising prices from tariffs. Retailers use AI chatbots to boost conversions by 9%, and 75% of global shoppers plan to grab deals during Black Friday and Cyber Monday (BFCM).
These Black Friday statistics 2025 reveal shifting habits, from early bird deals to cross-border buys. If you run a business, market products, or just love scoring bargains, use this data to plan ahead.
Learn how to spot real discounts, optimize your store, or time your purchases for maximum savings. This guide dives deep into the numbers and shows you practical ways to benefit.
Key Black Friday Statistics 2026 (Top Picks)
These highlights capture the essence of Black Friday 2025. They help you understand the scale and spot opportunities for your shopping or business strategy.
- Experts forecast U.S. online Black Friday sales between $12 and $12.5 billion, up from $10.8 billion in 2024.
- Global online spending reaches $80 to $82 billion, building on 2024’s $74.4 billion with a 5-10% increase.
- 75% of global shoppers make purchases during BFCM, driven by discounts and exclusive offers.
- Mobile devices account for 73% of purchases, up from 69% in 2024.
- BNPL spending hits new highs, with 50% of shoppers encouraged by flexible payments.
- AI influences 54% of buyers for price comparisons and recommendations.
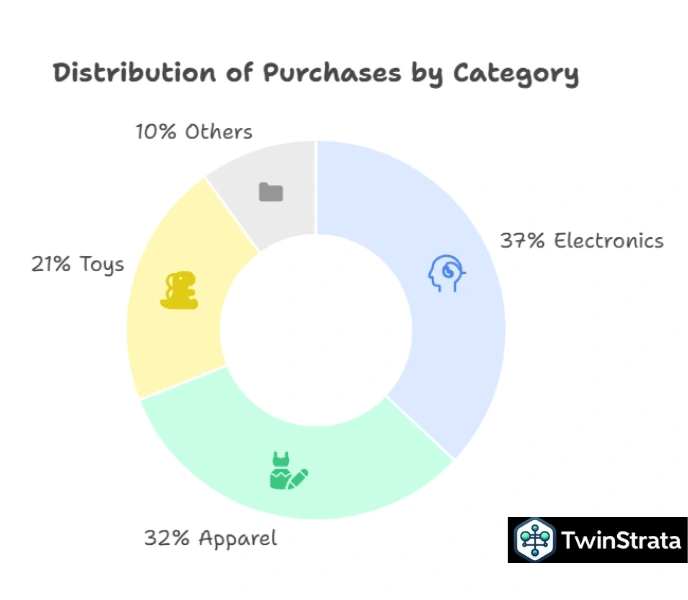
- Electronics top the list at 37% of purchases, followed by clothing at 32%.
- 53% of shoppers buy from other countries for better prices.
- Retailers see 57% sales uplift during holidays, with BFCM making up over 20% of annual revenue for 73% of merchants.
- High spenders (27% of shoppers) drive 68% of total holiday spending, averaging $2,146 each.
Use these to your advantage: Businesses boost email campaigns, as they drive 23% of holiday sales. Shoppers start early to avoid stockouts from tariffs.
Black Friday Sales Statistics 2026
Black Friday drives massive revenue, with online sales leading the charge. Projections for 2025 show U.S. online spending soaring to $12-12.5 billion, a 11-16% rise from 2024’s record $10.8 billion. This growth stems from extended deals and mobile convenience. Globally, sales hit $80-82 billion, fueled by cross-border shopping.
Retailers stretch promotions from October, turning Black Friday into a season. Tariffs may hike prices on imports, pushing shoppers to buy early. In 2024, U.S. sales jumped 10.2% year-over-year, with online up 14.6% while in-store grew just 0.7%. Expect similar trends in 2025, with digital dominance.
You benefit by monitoring prices with AI tools—54% of shoppers do this to snag real deals. Businesses optimize sites, as 33.4% of merchants prioritize performance for faster checkouts.
Here’s a table of U.S. Black Friday online sales over years, with 2025 projection:
| Year | Online Sales (U.S.) |
| 2025 | $12-12.5 billion |
| 2024 | $10.8 billion |
| 2023 | $9.8 billion |
| 2022 | $9.12 billion |
| 2021 | $8.92 billion |
| 2020 | $9.03 billion |
| 2019 | $7.4 billion |
| 2018 | $6.2 billion |
| 2017 | $5 billion |
Sources: eMarketer
Shopify merchants expect another boom, following 2024’s $4.1 billion on Black Friday (22% up). With peak sales at $4.6 million per minute, prepare your store for traffic spikes.
Black Friday Shopper Statistics 2026
Shoppers flock to Black Friday, with 75% globally planning purchases. In 2025, expect 152-160 million U.S. participants, similar to 2024’s 152 million. Gen Z and Millennials lead, with only 9% skipping. Baby Boomers lag at 27% non-buyers.
Behavior shifts: 71% chase discounts, 49% love exclusives. 64% rely on social reviews, 58% follow trends. Cross-border buys rise to 53%, seeking lower prices.
Benefit by joining early: 21% shop midnight to 6 a.m. Businesses target segments—bargain hunters (18-55) with limited-time ads.
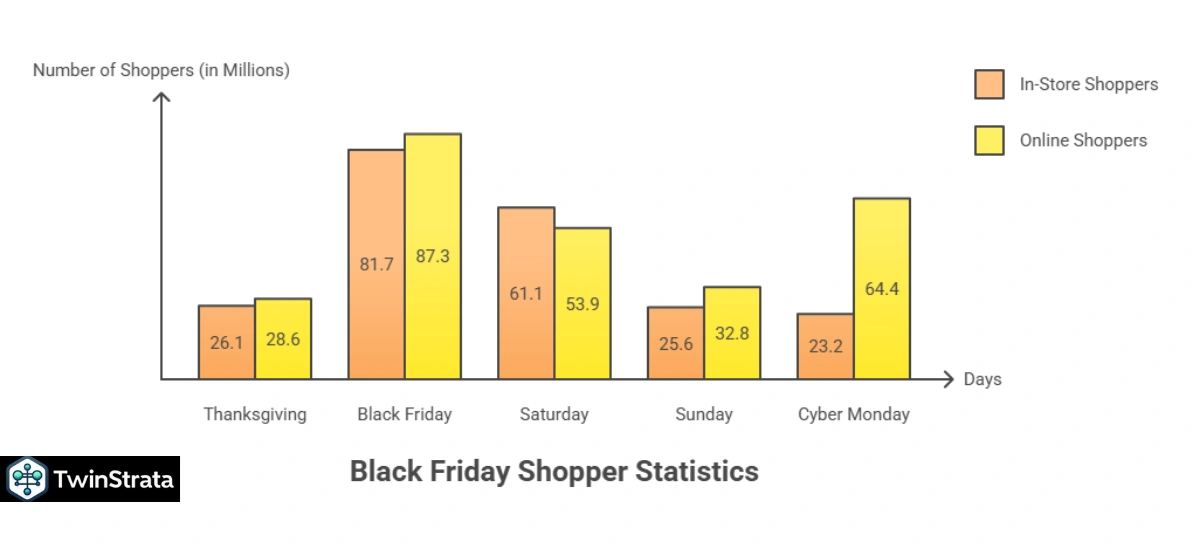
Table of shoppers during Thanksgiving week (2024 actual, 2025 similar expected):
| Day | Online Shoppers | In-Store Shoppers |
| Thanksgiving | 28.6 million | 26.1 million |
| Black Friday | 87.3 million | 81.7 million |
| Saturday | 53.9 million | 61.1 million |
| Sunday | 32.8 million | 25.6 million |
| Cyber Monday | 64.4 million | 23.2 million |
Source: NRF.
Use to time promotions—Black Friday balances online/in-store.
High spenders (27%) spend $2,146, buying 10 gifts. Focus on them for big revenue.
Global Black Friday Sales 2026
Global spending surges to $80-82 billion online, up 7-10% from 2024’s $74.4 billion. Europe sees 33% buying more, Nigeria 63%. Trust varies: Poland 74%, Thailand 30%.
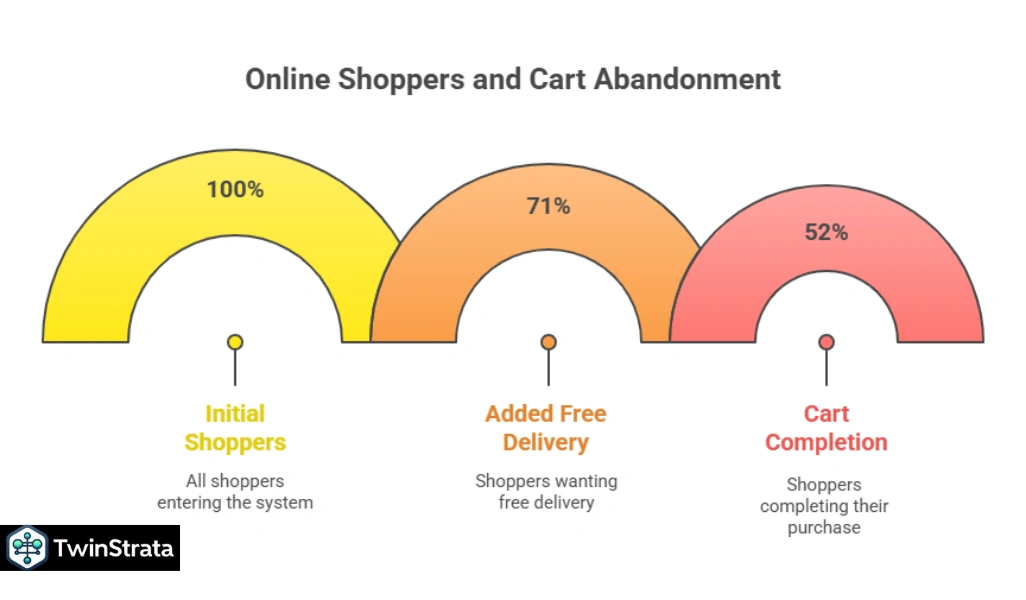
Electronics dominate at 37%, clothing 32%. 71% want free delivery, 48% abandon carts without preferred options.
You gain by offering international shipping—45% cross-border for prices. Retailers use DOOH ads near malls.
Holiday Sales Statistics 2026
Holiday spending (Nov-Dec) reaches $271.58 billion in U.S. ecommerce, up 9.5%. 2024 hit $241.1 billion, 8.6% growth.
BNPL totals $18.2 billion in 2024, expect 10%+ rise. Mobile BNPL 79%.
Table of holiday spending:
| Year | U.S. Spending |
| 2025 | $271.58B |
| 2024 | $241.1B |
| 2023 | $222.1B |
| 2022 | $210B |
| 2021 | $205B |
Source: eMarketer. Plan budgets—high spenders drive 68%.
Mobile and BNPL Statistics 2026
- Mobile hits 73% of purchases, up from 69%. Desktops convert at 6.5% vs. mobile’s 3.2%.
- BNPL encourages 50%, with Cyber Monday records at $991.2 million in 2024.
- Optimize apps—42% prefer them. Add BNPL to boost carts.
Retail Black Friday Stats 2026
- Target exceeds $500 million in 2024, Walmart $1.77 billion. In 2025, memberships like Prime offer exclusives.
- Shopify peaks at $4.6M/min. 42% merchants change strategies: 30% add subscriptions.
Black Friday Discounts 2026
- Average 26% globally, 28% U.S. Makeup 40%, apparel 34%.
- 57% want advance info. Skepticism: 57% doubt deals.
- Track with tools—avoid fakes.
Table of 2024 discounts (2025 similar):
| Product | Discount |
| Earrings | 23% |
| Rings | 22% |
| Shirts & Tops | 22% |
| Pants | 22% |
| Coats & Jackets | 22% |
Black Friday Shopping Trends 2026
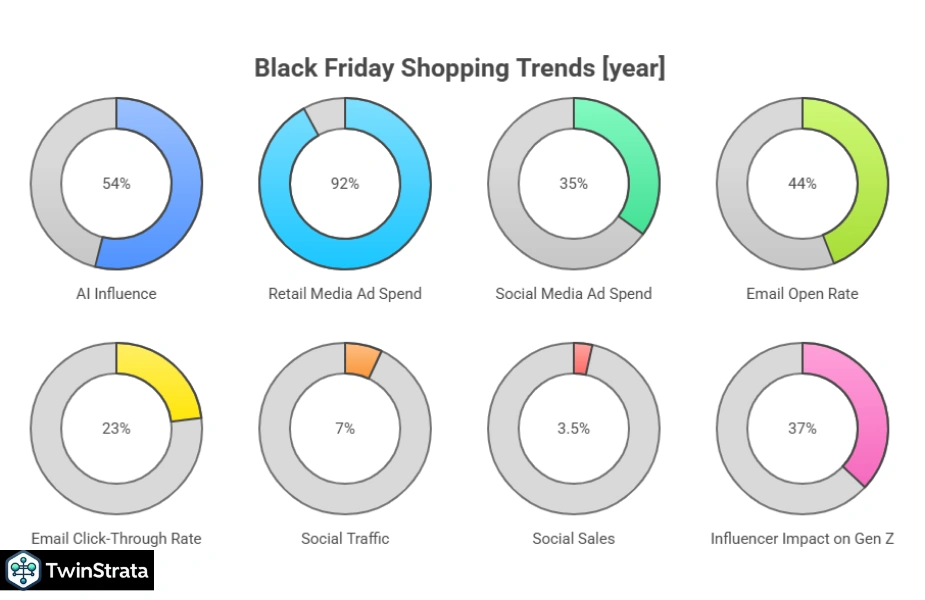
- Deals stretch out, AI use by 54%. Sustainable shopping rises. Social influences 55%.
- Ad spend: Retail media +92%, social +35%.
- Email open rates up 44%, CTR 23%.
Latest Insights from Quora and Reddit on Black Friday Statistics 2026
Users on Quora and Reddit discuss 2025 trends, seeking real deals amid hype. On Quora, questions like “How long will Black Friday remain big?” highlight stats showing it’s the top day, but Singles Day pressures it with massive sales. Users ask about discounts—average 25%, up to 80%—and if electronics deals beat year-round.
Reddit threads question deal quality: “Black Friday deals seem garbage,” with users noting old stock clearance. Some doubt record claims, but 2025 Prime Day’s $24.1B (30% up) suggests strong holidays. Discussions on streaming deals and tracking tools like Serval add fresh tips.
These forums reveal skepticism—98% deals cheaper elsewhere sometimes—but optimism for 2025 with AI and early starts.
How to Use Black Friday Statistics 2026 for Your Benefit
These stats empower you. Shoppers: Use AI for comparisons, buy cross-border for savings, add BNPL for flexibility.
- Businesses: Optimize mobile (73%), add subscriptions (30% plan), use email (23% effective). Target high spenders, offer free delivery (71% want).
- Prepare early—33% prioritize performance. Segment audiences: Bargain hunters with timed ads.
- With 75% participating, stand out with personalization.
FAQs About Black Friday Statistics
1. What are projected Black Friday sales for 2025?
U.S. online: $12-12.5B; global: $80-82B.
2. How many shoppers participate in Black Friday 2025?
75% globally, around 152-160M in U.S.
3. What role does mobile play in 2025?
73% purchases, focus on apps for better conversions.
4. Are Black Friday deals genuine?
Average 26-28%, but 57% doubt—use tools to verify.
5. How does AI impact shopping?
54% use for deals, retailers boost conversions 9%.
6. What's the best strategy for businesses?
Stretch deals, optimize sites, target segments with data.
Also Read:
- Social Media Statistics
- Video Marketing Statistics
- Digital Marketing Statistics
- Google Searches Statistics
- Crm Statistics
Conclusion
Black Friday 2025 promises record highs, with $12-12.5B U.S. online and $80-82B global. Mobile, AI, and BNPL drive shifts, while 75% shoppers chase discounts on electronics and apparel. Forums like Quora and Reddit highlight skepticism but confirm its power.
Use these Black Friday statistics 2025 to shop smart or boost sales—optimize mobile, personalize, start early. Whether saving big or growing revenue, Black Friday remains key for holiday success. Stay informed, act strategically, and enjoy the deals.
Sources: Salesforce, Adobe, Shopify