Uber dominates the ride-hailing world with over 76% market share in many regions. The company connects millions of riders with drivers every day.
People often search for “number of Uber Drivers statistics 2025” to understand this growing industry. Drivers complete billions of trips each year, and the platform generates massive revenue.
In the first half of 2025, Uber drivers handled 6.29 billion trips, bringing in $24.18 billion in revenue.
This article dives deep into the latest Uber statistics for 2025. I pull data from Uber’s financial reports, investor updates, and trusted sources like Statista and Business of Apps.
We focus on the number of Uber drivers, but we also cover users, trips, earnings, and more. Readers who want to know about the number of Uber drivers can use this info for smart decisions.
Potential drivers learn about earnings and growth. Riders see how driver numbers affect wait times and prices. Investors spot trends in this booming market.
Uber continues to expand, but challenges like low pay and competition from self-driving cars spark debates online. On Reddit and Quora, users ask about future driver numbers in 2025.
Some predict drops due to policy changes, while others see influxes of new drivers. We mix facts with these insights to give you a full picture. Let’s explore how the number of Uber drivers shapes opportunities for everyone.
Uber’s Global Reach and User Base
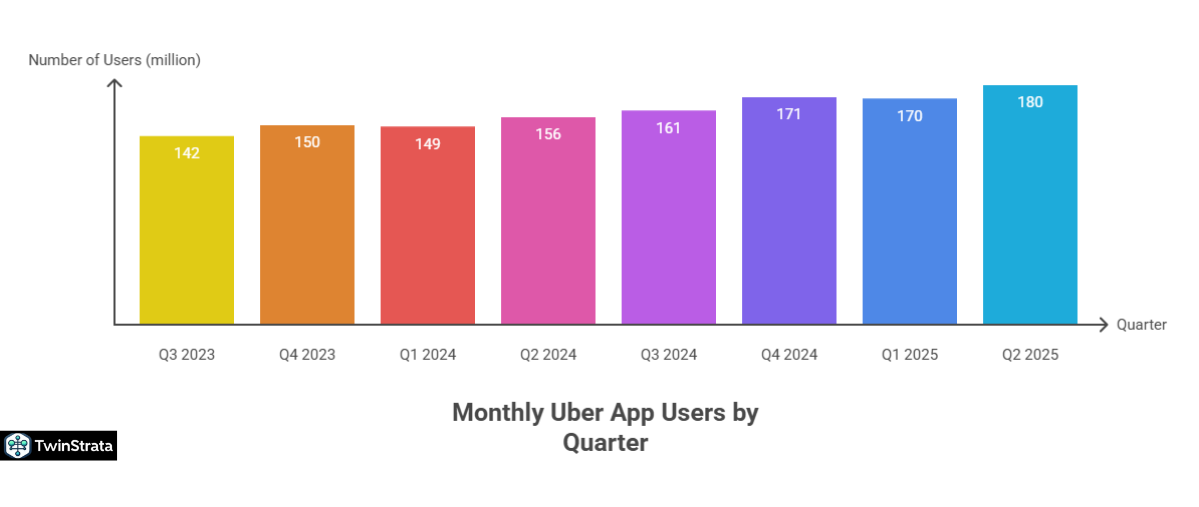
Uber serves riders in over 10,000 cities across 72 countries. The app draws 180 million monthly active users in 2025. This marks a 15% jump from 2024. Riders take more trips as cities recover from past disruptions.
The number of Uber users grows steadily each quarter.
Check this table for details:
| Quarter | Number of Monthly Active Users |
| Q2 2025 | 180 million |
| Q1 2025 | 170 million |
| Q4 2024 | 171 million |
| Q3 2024 | 161 million |
| Q2 2024 | 156 million |
| Q1 2024 | 149 million |
| Q4 2023 | 150 million |
| Q3 2023 | 142 million |
| Q2 2023 | 137 million |
| Q1 2023 | 130 million |
| Q4 2022 | 131 million |
| Q3 2022 | 124 million |
| Q2 2022 | 122 million |
| Q1 2022 | 115 million |
Source: Uber.
This growth benefits potential drivers. More users mean more ride requests. If you drive for Uber, higher demand can boost your earnings. Riders enjoy shorter waits in busy areas. Investors note this user surge as a sign of strong market position.
Demographics show who uses Uber. In the US, 48% of users are women and 52% are men. Ages vary, with 37% between 16-24 years old. Suburban areas host 48% of users, urban 46%, and rural 6%. Income levels include 44% average earners, 27% top 25%, and 22% bottom 25%.
| Gender | Percentage of Uber Users |
| Female | 48% |
| Male | 52% |

| Age Group | Percentage of Uber Users |
| 16-24 years | 37% |
| 25-34 years | 28% |
| 35-44 years | 17% |
| 45-54 years | 12% |
| 55-64 years | 6% |
| Region | Percentage of Uber Users |
| Urban | 46% |
| Suburban | 48% |
| Rural | 6% |
| Income Group | Percentage of Uber Users |
| Bottom 25% earners | 22% |
| Mid-50% earners | 44% |
| Top 25% earners | 27% |
| Prefer not to say | 7% |
These stats help drivers target peak times. Young users often ride at night, boosting weekend earnings. Suburban focus means more airport runs. Riders benefit from diverse drivers matching their needs.
- Also read about: Social Media Statistics
The Core Question: How Many Uber Drivers Are There in 2026?
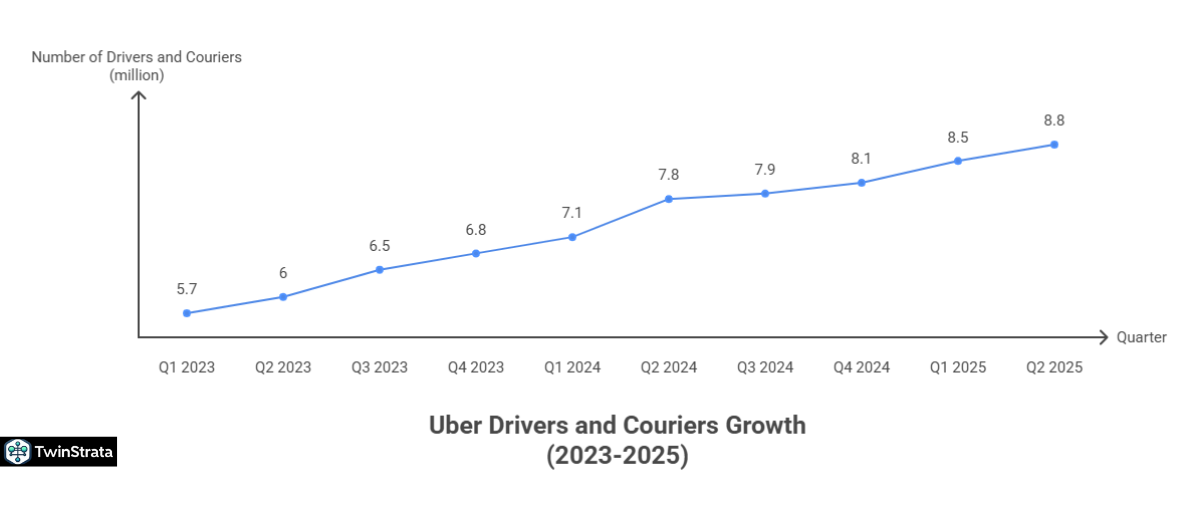
Uber boasts over 8.8 million drivers worldwide in Q2 2025. This represents a 12.05% increase from 7.8 million in Q2 2024. Drivers include couriers for Uber Eats. The number grows as more people seek flexible work.
See the trend in this table:
| Quarter | Number of Uber Drivers and Couriers |
| Q2 2025 | 8.8 million |
| Q1 2025 | 8.5 million |
| Q4 2024 | 8.1 million |
| Q3 2024 | 7.9 million |
| Q2 2024 | 7.8 million |
| Q1 2024 | 7.1 million |
| Q4 2023 | 6.8 million |
| Q3 2023 | 6.5 million |
| Q2 2023 | 6 million |
| Q1 2023 | 5.7 million |
Source: Business of Apps
This rise in the number of Uber drivers statistics 2025 shows opportunity. New drivers join for side income. In India, over 1.5 million drivers operate, making it a key market after the US. Zero-emission vehicles (ZEV) drivers number 230,000. They completed 105.5 million trips in Q1 2025, highlighting green trends.
Online forums buzz with questions about these numbers. On Quora, users ask how many hours drivers work weekly. Data shows males average 17.98 hours, females 12.82 hours.
Reddit threads predict changes in 2025. Some say tariffs could drop earnings to $15-16 per hour, causing drivers to leave. Others mention 350,000 Venezuelan drivers facing TPS loss, potentially reducing numbers. Waymo’s self-driving rides take 33% repeat customers, more than Uber’s 23%. This competition might shrink driver pools.
For readers, these stats mean benefits. Aspiring drivers assess market saturation. In high-driver areas, competition rises, but demand often matches.
Use apps to find low-competition zones for better pay. Riders get reliable service with more drivers. Businesses partner with Uber for deliveries, knowing driver numbers support volume.

Earnings vary. Males earn $21.28 hourly, females $20.04. Weekly, that’s $397.68 for men and $268.18 for women. Monthly, 45% earn $0-99, 39% $100-499, 11% $500-999, 4% $1000-1499, 2% $1500-1999, and 0% $2000+.
| Monthly Earnings | Percentage of Uber Drivers |
| $0-99 | 45% |
| $100-499 | 39% |
| $500-999 | 11% |
| $1000-1499 | 4% |
| $1500-1999 | 2% |
| $2000+ | 0% |
- Also read about: iphone Users Statistics
Uber Trips and Bookings: Fueling Driver Opportunities
Drivers complete 3.26 billion trips in Q2 2025, up from 3.03 billion in Q1. Full 2024 saw 11.27 billion trips, a 19% rise from 2023.
| Year | Number of Trips |
| 2025 (Q1+Q2) | 6.29 billion |
| 2024 | 11.27 billion |
| 2023 | 9.44 billion |
| 2022 | 7.64 billion |
| 2021 | 6.36 billion |
| 2020 | 4.98 billion |
| 2019 | 6.9 billion |
| 2018 | 5.21 billion |
Gross bookings hit $46.7 billion in Q2 2025, totaling $89.5 billion for H1.
| Year | Gross Bookings |
| 2025 (Q1+Q2) | $89.5 billion |
| 2024 | $162.7 billion |
| 2023 | $137.8 billion |
| 2022 | $115.3 billion |
| 2021 | $90.4 billion |
| 2020 | $57.8 billion |
| 2019 | $65 billion |
Revenue and Profit: What It Means for Drivers and Users
Uber will earn $43.97 billion in 2024, up 18% from 2023. H1 2025 brings $24.18 billion.
| Year | Net Revenue |
| 2025 (Q1+Q2) | $24.18 billion |
| 2024 | $43.97 billion |
| 2023 | $37.28 billion |
| 2022 | $31.87 billion |
| 2021 | $17.45 billion |
| 2020 | $11.13 billion |
| 2019 | $13 billion |
| 2018 | $11.3 billion |
| 2017 | $7.5 billion |
| 2016 | $6.5 billion |
Mobility leads with $25.08 billion in 2024. Delivery adds $13.75 billion, freight $5.14 billion.
| Year | Mobility | Delivery | Freight | Other |
| 2025 (Q1+Q2) | 13.78B | 7.88B | 2.52B | N/A |
| 2024 | 25.09B | 13.75B | 5.14B | N/A |
| 2023 | 19.83B | 12.20B | 5.26B | N/A |
| 2022 | 14.03B | 10.90B | 6.95B | N/A |
| 2021 | 6.95B | 8.36B | 2.13B | 0.01B |
| 2020 | 6.09B | 3.90B | 1.01B | 0.14B |
| 2019 | 10.71B | 1.40B | 0.73B | 0.16B |
| 2018 | 9.29B | 0.77B | 0.36B | 0.02B |
| 2017 | 7.28B | 0.59B | 0.07B | N/A |
By region, US/Canada leads with $27.4 billion in 2024.
| Year | US & Canada | Latin America | EMEA | APAC |
| 2024 | $27.4B | $2.1B | $10.1B | $4.3B |
| 2023 | $22.7B | $2.0B | $8.5B | $4.0B |
| 2022 | $19.5B | $1.98B | $6.9B | $3.5B |
| 2021 | $10.1B | $1.4B | $3.2B | $2.7B |
| 2020 | $6.6B | $1.3B | $2.1B | $1.2B |
| 2019 | $8.5B | $1.9B | $1.9B | $0.8B |
| 2018 | $6.5B | $2.0B | $1.7B | $1.0B |
| 2017 | $4.4B | $1.7B | $1.2B | $0.8B |
Profit hits $9.8 billion in 2024, up from $1.8 billion in 2023.
| Year | Net Income/Loss (millions USD) |
| 2024 | 9,856 |
| 2023 | 1,887 |
| 2022 | -9,141 |
| 2021 | -496 |
| 2020 | -6,768 |
| 2019 | -8,506 |
| 2018 | 997 |
| 2017 | -4,033 |
| 2016 | -370 |
Market Share and Competition

Uber holds 74% US ride-hailing share, Lyft 26%. Uber Eats has 24%, behind DoorDash’s 59%.
| Food Delivery Platform | Market Share |
| DoorDash | 59% |
| Uber Eats | 24% |
| Grubhub | 14% |
| Postmates | 3% |
| Others | 1% |
Brand awareness stands at 90%, popularity 61%.
| Metric | Percentage |
| Awareness | 90% |
| Popularity | 61% |
| Usage | 62% |
| Loyalty | 55% |
| Buzz | 48% |
Uber One Membership and Expenses
Uber One has 5 million members in 16 countries at $9.99/month. Benefits include discounts.
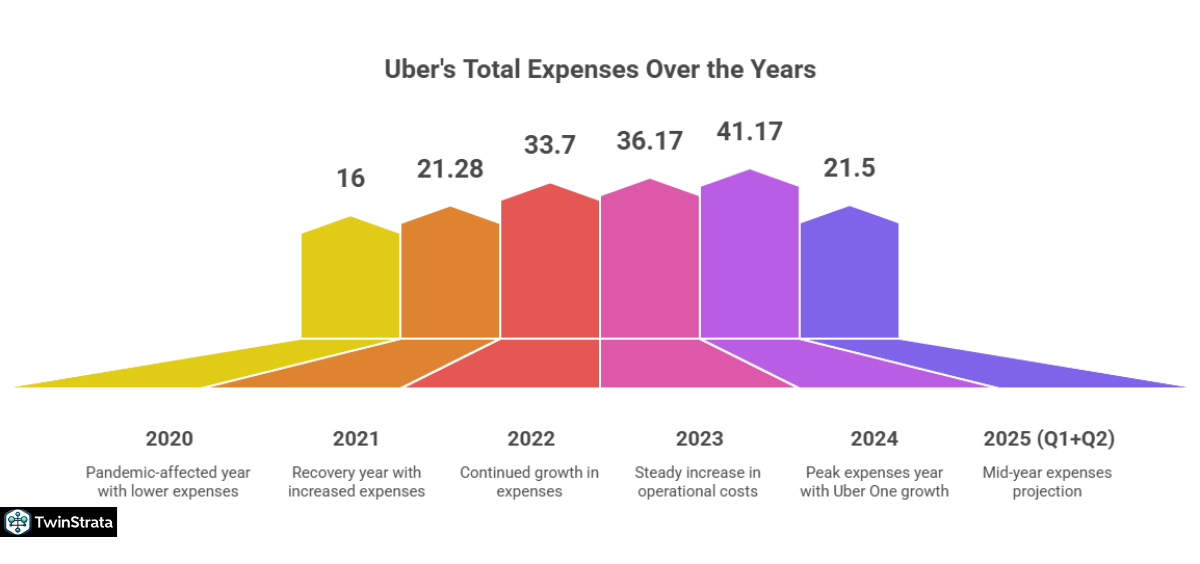
Expenses reach $41.17 billion in 2024.
| Year | Total Expenses |
| 2025 (Q1+Q2) | $21.5 billion |
| 2024 | $41.17 billion |
| 2023 | $36.17 billion |
| 2022 | $33.7 billion |
| 2021 | $21.28 billion |
| 2020 | $16 billion |
| 2019 | $21.59 billion |
Ad spend hits $1.9 billion in 2024.
| Year | Ad Expenditure |
| 2024 | $1.9B |
| 2023 | $1.69B |
| 2022 | $1.7B |
| 2021 | $1.7B |
| 2020 | $1B |
| 2019 | $1.3B |
| 2018 | $1.3B |
Employees and Funding
Uber employs 56.5% males, 43.5% females in 2024.
| Year | Female % | Male % |
| 2024 | 43.5 | 56.5 |
| 2023 | 42.6 | 57.4 |
| 2022 | 42.5 | 57.5 |
| 2021 | 42.2 | 57.8 |
| 2020 | 40.3 | 59.7 |
| 2019 | 40.9 | 59.1 |
| 2018 | 38 | 62 |
| 2017 | 36.1 | 63.9 |
Funding totals $35.8 billion in 2025.
| Year | Cumulative Funding |
| 2025 | $35.8B |
| 2024 | $26.4B |
| 2020 | $21.4B |
| 2019 | $20.9B |
| 2018 | $18.9B |
| 2016 | $9.14B |
| 2015 | $5.64B |
| 2014 | $4.64B |
| 2013 | $0.44B |
| 2011 | $0.06B |
Uber Eats and Acquisitions
Uber Eats operates in 10,500 cities, partners with 825,000 restaurants in 2022.
| Year | Cities | Restaurants |
| 2023 | 10,500 | – |
| 2022 | 10,000 | 825,000 |
| 2021 | 6,000 | 900,000 |
| 2020 | 1,000 | 600,000 |
| 2019 | 500 | 220,000 |
| 2018 | 200 | 100,000 |
| 2017 | 120 | 80,000 |
Acquisitions include Crowntaxi and Dantaxi in 2025.
| Company | Year |
| Crowntaxi | 2025 |
| Dantaxi | 2025 |
| Trendyol Go | 2025 |
| Car Next Door | 2022 |
| HK Taxi | 2021 |
| Transplace | 2021 |
| Drizly | 2021 |
| Postmates | 2020 |
| Careem | 2020 |
| Routematch | 2020 |
| Autocab | 2020 |
| Cornershop | 2019 |
| Mighty AI | 2019 |
| JUMP Bikes | 2018 |
| orderTalk | 2018 |
| Swipe Labs | 2017 |
| Otto | 2016 |
| Geometric Intelligence | 2016 |
| deCarta | 2015 |
What People Are Asking? Key Insights For Quora & Reddit
1. How are Uber drivers paid? Is it based on the number of rides or the miles driven? Can you explain how this payment system works?
- This dives into the fare structure, including base fees, mileage rates, and time-based pay.
2. What is the average hourly income for Uber drivers in the US? How many hours do they typically work per week and how many rides/miles do they complete on average?
- Focuses on earnings, work hours, and typical ride volumes for a realistic picture.
3. What are the qualifications for driving for Uber Black compared to regular Uber drivers?
- Compares requirements like vehicle standards and licenses for premium vs. standard services.
4. Can I drive for Uber or Lyft with an old car?
- Explores vehicle age limits and exceptions for older models.
5. What’s Uber’s reputation in 2025? (from r/cscareerquestions, but tied to driver pay cuts)
- Users discuss the company’s image, cost-cutting, and impacts on drivers like reduced pay.
6. Starting in January 2025, will Avis’s shift to electric vehicle rentals for Uber drivers make things harder?
- Talks about the end of gas-powered rentals and incentives for zero-emission rides.
7. Uber drivers: What are your future predictions through 2025?
- Predictions on economy, tariffs, and low ride pay persisting into 2025.
FAQs About Uber Statistics
1. What is the current number of Uber drivers in 2025?
The number of Uber drivers and couriers stands at 8.8 million worldwide as of Q2 2025, showing steady growth from previous years.
2. How can I use Uber driver statistics to decide if I should become a driver?
You can analyze the number of Uber drivers statistics 2025 to check market saturation in your area, estimate potential earnings based on trip volumes, and identify high-demand times for better income opportunities.
3. What impact do increasing driver numbers have on riders?
Increasing driver numbers in 2025 lead to shorter wait times, more reliable service, and potentially lower prices during non-peak hours due to higher supply.
4. Are there any new trends affecting Uber driver numbers in 2025?
Discussions on platforms like Reddit indicate that policy changes, low pay, and competition from self-driving services like Waymo might cause some drivers to leave, potentially stabilizing or reducing numbers in certain regions.
5. How do Uber driver earnings vary in 2025?
Uber driver earnings in 2025 average $21.28 per hour for males and $20.04 for females, with most drivers earning under $500 monthly, but top performers maximize by working peak hours and accepting high-value rides.
Also Read:
- Amazon Statistics
- Google Chrome Statistics
- WordPress Statistics
- Microsoft Teams Statistics
- Gmail Statistics
Conclusion: Leveraging Uber Driver Stats for Your Benefit
Uber thrives with 180 million users and 8.8 million drivers in 2025. Trips and revenue soar. Forums like Reddit highlight risks like driver exits and autonomous competition.
Use these numbers of Uber Drivers statistics 2025 to your advantage. Drivers optimize schedules. Riders expect better service. Investors bet on growth.