Video marketing dominates digital strategies in 2025. Businesses use it to engage audiences and drive sales. Experts predict video will account for 82% of internet traffic this year.
Users spend about 100 minutes daily watching online videos. This shift makes video essential for marketers. In this article, we explore video marketing statistics 2025. We combine key data from recent reports.
Why Video Marketing Matters in 2026
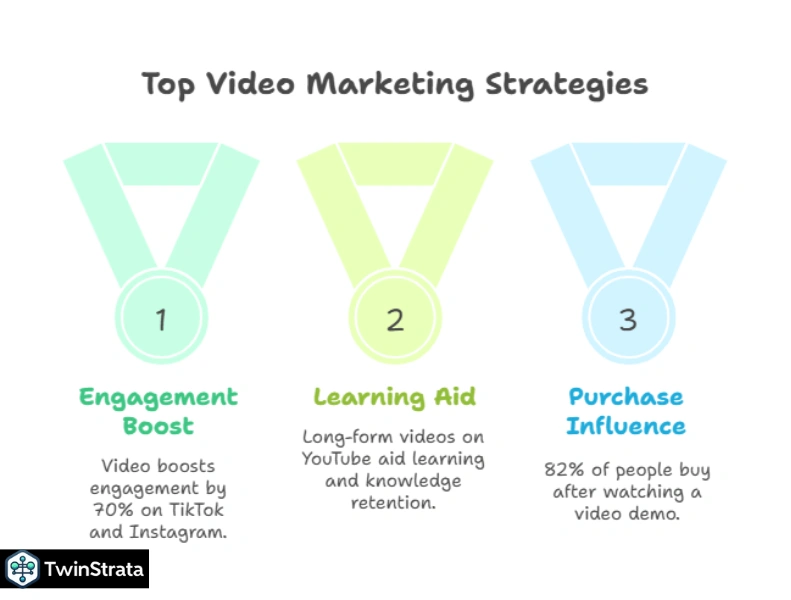
Brands compete for attention online, and video stands out. It boosts engagement by 70% on platforms like TikTok and Instagram, where short clips drive quick interactions.
Long-form videos on YouTube aid learning, and marketers see video as crucial. 89% use it actively, and 95% call it a key tool. These numbers show growth. You can use video to build trust, as it influences purchases—82% of people buy after watching a video.
With the rise of AI video generators, creating high-quality video content has never been easier. Apply this: Create product demos, share them on social media, and track views and sales. This turns stats into profits.
- Key Quick Wins: Start with short videos under 1 minute. They engage 50% of viewers. Add calls to action. Encourage shares.
- Business Benefit: Videos increase site time by 88%. This improves SEO. Search engines favor engaging content.
Video Marketing Usage Statistics 2026
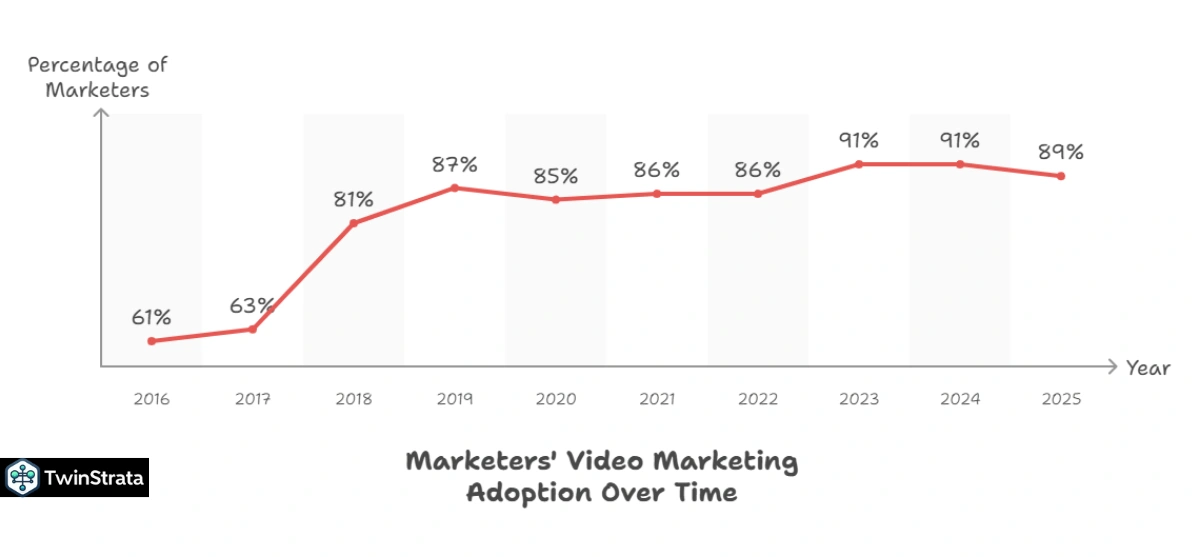
Marketers adopt video widely. 91% integrate it into strategies. This holds steady from 2024. Growth started years ago. In 2017, only 63% used it. By 2018, it jumped to 81%. The rise ties to social media. Platforms reward video posts.
Use this trend: Survey your team. If you lag, start small. Invest in tools like smartphone apps. 38% of videos come from them.
Here’s a table showing usage over time:
| Year | Percentage of Marketers Using Video |
| 2025 | 89% |
| 2024 | 91% |
| 2023 | 91% |
| 2022 | 86% |
| 2021 | 86% |
| 2020 | 85% |
| 2019 | 87% |
| 2018 | 81% |
| 2017 | 63% |
| 2016 | 61% |
Source: Statista
95% of marketers view video as crucial, up from 88% in 2024. While dips occur, like in 2024, the overall trend shows growth—from 78% in 2015 to 95% now.
Apply it: Make video central to your strategy. Train staff to leverage video effectively for email marketing and ads. Use video in emails to increase engagement and click-through rates, ensuring your messages stand out in crowded inboxes.
Table: Marketers Who See Video as Crucial
| Year | Share of Marketers |
| 2025 | 95% |
| 2024 | 88% |
| 2023 | 96% |
| 2022 | 92% |
| 2021 | 93% |
| 2020 | 92% |
| 2019 | 91% |
| 2018 | 85% |
| 2017 | 82% |
| 2016 | 88% |
| 2015 | 78% |
85% plan to keep or boost video spending. 60% invest more. 25% stay the same. 15% cut back.
Breakdown:
- Invest more: 60%
- Invest same: 25%
- Invest less: 15%
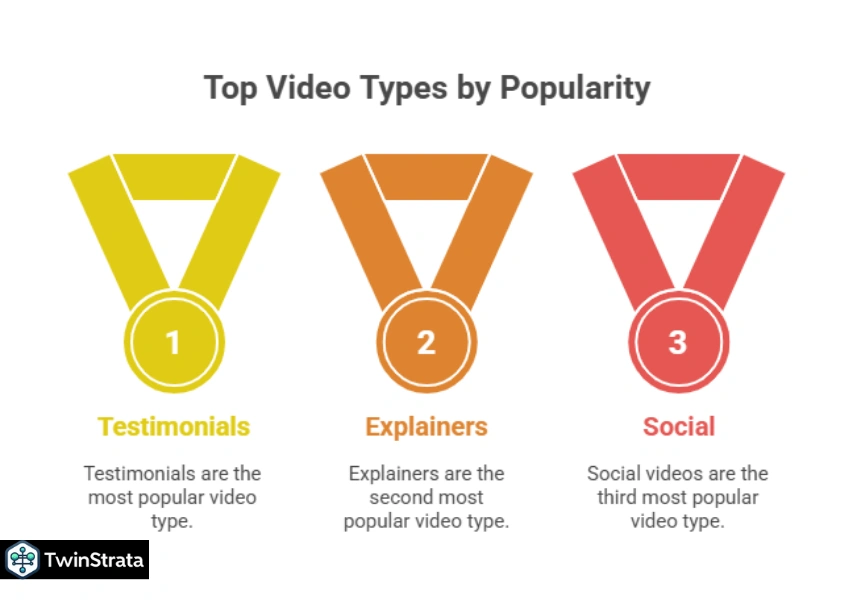
Popular video types: Testimonials lead at 39%. Explainers follow at 38%.
Table: Most Created Video Types
| Video Type | Percentage |
| Testimonial videos | 39% |
| Explainer videos | 38% |
| Social media videos | 34% |
| Presentation videos | 34% |
| Product and demo videos | 32% |
| Sales videos | 30% |
| Teaser videos | 30% |
| Video ads | 30% |
| Customer service videos | 28% |
| Videographics | 25% |
| Employee onboarding videos | 25% |
| Customer onboarding videos | 22% |
| Staff training videos | 22% |
| App demo videos | 22% |
30% of non-users plan short-form starts. 25% increase investment. Short-form gives high ROI.
From Reddit discussions: Users ask about video in real estate. 73% of homeowners list with video-using agents. 51% of buyers search YouTube first. Apply: If in niche markets, add videos. Boost listings.
Video Marketing ROI Statistics
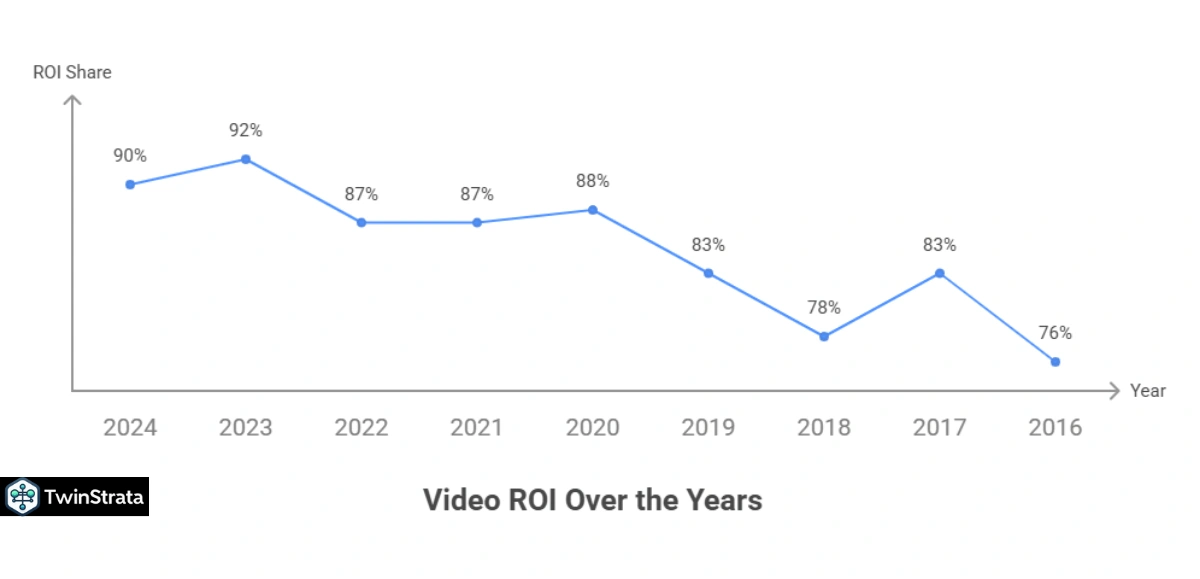
Video delivers results. 90% report positive ROI. Down from 92% in 2023. But up from 76% in 2016.
Table: Positive ROI Over Years
| Year | Percentage |
| 2024 | 90% |
| 2023 | 92% |
| 2022 | 87% |
| 2021 | 87% |
| 2020 | 88% |
| 2019 | 83% |
| 2018 | 78% |
| 2017 | 83% |
| 2016 | 76% |
- 87% say videos boost sales. Same for leads. 82% note longer site stays. 90% credit brand awareness.
- Use this: Measure ROI. Track metrics like views and conversions. Adjust based on data.
- Video users grow revenue 49% faster. They see 27% higher click-throughs. 34% better conversions.
- 66% more qualified leads yearly. 84% say video aids lead gen. Sites with video rank higher. 53 times more likely on page one.
- From Quora: Users discuss SEO ties. Video boosts strategies. One post links Wyzowl data, echoing growth.
Video Engagement Statistics
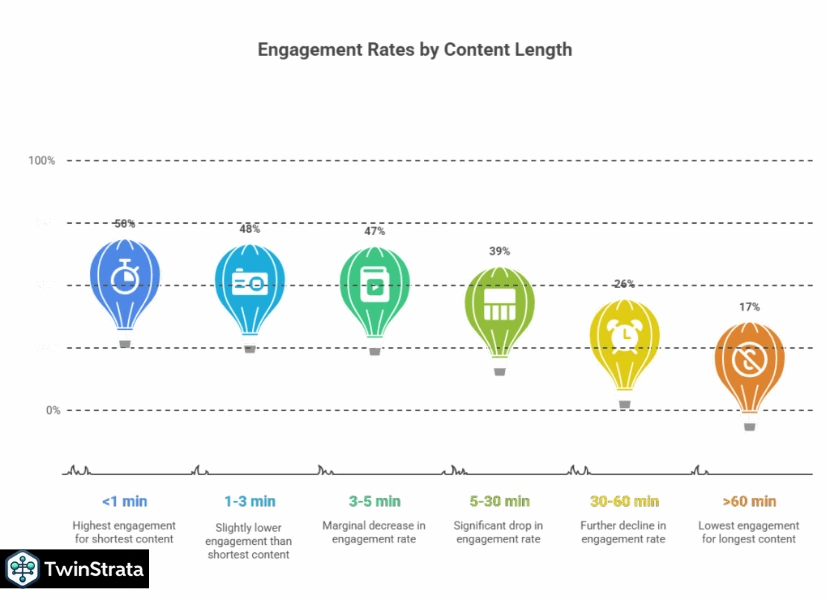
Short videos engage best. Under 1 minute: 50% rate. Over 60 minutes: 17%.
Video Marketing ROI Statistics
| Length | Rate |
| <1 min | 50% |
| 1-3 min | 48% |
| 3-5 min | 47% |
| 5-30 min | 39% |
| 30-60 min | 26% |
| >60 min | 17% |
Livestreams reach 27.7%. Music videos top at 48.2%.
Table: Popular Content Reach
| Type | Reach |
| Music video | 48.2% |
| Comedy/meme/viral | 35% |
| Video livestream | 27.7% |
| Educational | 26% |
| Tutorial/how-to | 25.8% |
| Sports clips | 25.7% |
| Product review | 25.3% |
| Sports match/commentary | 23.5% |
| Influencer/vlogs | 23.4% |
| Gaming | 22.2% |
Organic engagement rises 41% with video SEO.
Apply: Focus on tutorials. They reach 25.8%. Add to your site. Boost traffic.
From Reddit: For viral shorts, aim for AVD over 120%. Loop videos. This hooks viewers.
Video Consumption Trends in 2026
Consumers crave videos. 89% want more from brands. Down from 91% in 2023. Up from 85% in 2018.
- 83% prefer video over text/audio.
- Video takes 82.5% of traffic. Up 88% since 2017.
- 80% choose video over reading.
- 66% find short-form most engaging. Watch rate: 81%. 59% view 41-80% length.
- 73% use short-form for product searches. 57% Gen Z prefer it.
- 85% marketers call short-form effective.
- 82% buy after video.
- 88% more time on video sites.
- Videos retain 95% info vs. 10% text.
- 96% higher click-through. Shared 1200% more.
- 85% US users watch online. Saudi Arabia/Turkey: 95%.
Table: Country Penetration
| Country | Share |
| Saudi Arabia | 95% |
| Turkey | 95% |
| China | 92% |
| New Zealand | 91% |
| Mexico | 88% |
| Australia | 88% |
| Philippines | 87% |
| Spain | 86% |
| India | 85% |
| Brazil | 85% |
| United States | 85% |
YouTube leads: 90% marketers use it. 2.7B users. 46 min daily.
Table: Platform Preferences
| Platform | Share |
| YouTube | 90% |
| 86% | |
| 79% | |
| 79% | |
| 54% | |
| TikTok | 35% |
- 75% watch on mobile.
- Average: 17 hours weekly. Down from 19 in 2022. Daily: 84 min global. China: 103 min.
- 50% seek product videos pre-store.
- 4x prefer video over reading.
- Shoppers 1.81x more likely buy after demo.
- 65% execs visit site post-video. 39% call.
Apply: Optimize for mobile. Use vertical format. From trends: Vertical video rises in 2025. It fits phones. Boost views.
Video Performance Stats
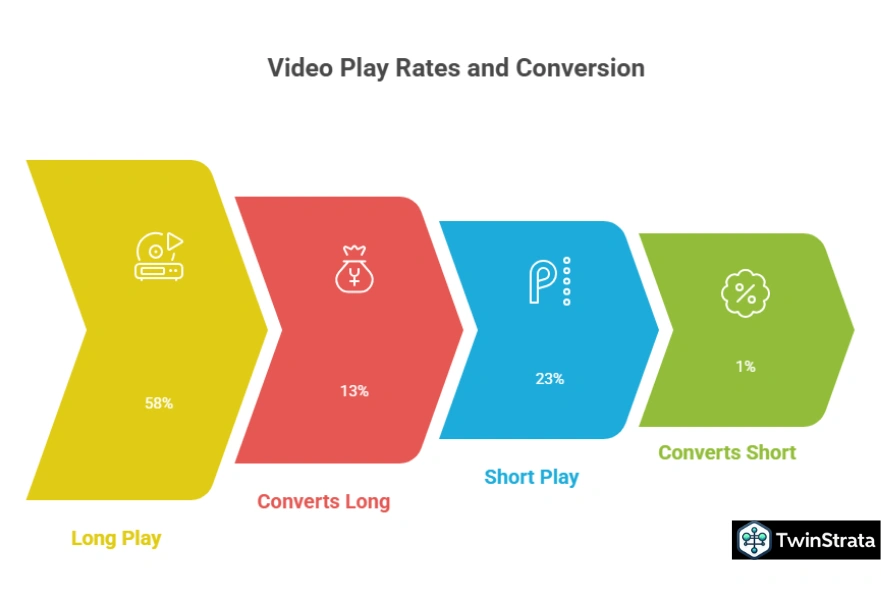
Long videos play more. Over 60 min: 58%. Under 1 min: 23%.
Table: Play Rate by Length
| Length | Rate |
| <1 min | 23% |
| 1-3 min | 12% |
| 3-5 min | 17% |
| 5-30 min | 35% |
| 30-60 min | 50% |
| >60 min | 58% |
Conversions high for long: 13%. Short: 1%.
Table: Conversion by Length
| Length | Rate |
| <1 min | 1% |
| 1-3 min | 4% |
| 3-5 min | 2% |
| 5-30 min | 11% |
| 30-60 min | 8% |
| >60 min | 13% |
Use: Mix lengths. Short for awareness. Long for education.
Video Production Statistics
- 38% create in-house. Down from 60% in 2023. 24% outsource. 38% mix.
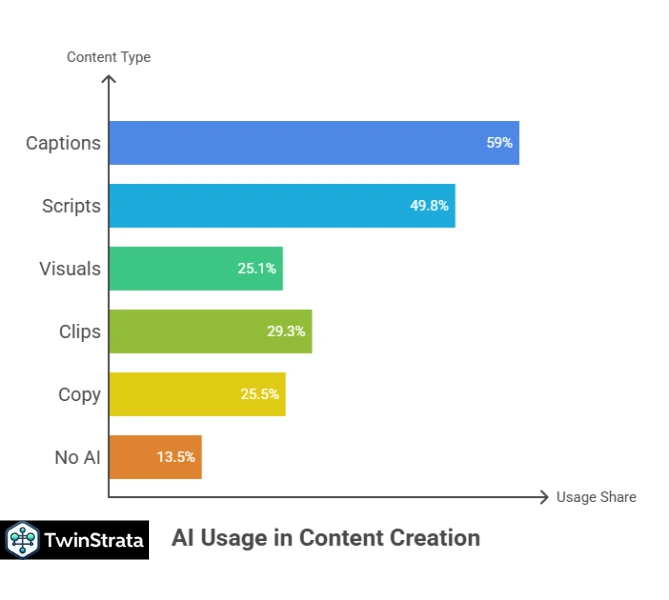
- 75% use AI for videos.
- 85% say AI transforms creation.
Table: AI Uses
| Use | Share |
| Captions/transcripts | 59% |
| Scripts/outlines/ideas | 49.8% |
| Visuals/music/overdubs | 25.1% |
| Find clips | 29.3% |
| Social copy | 25.5% |
| No AI | 13.5% |
45% want more product videos.
Table: Desired Types
| Type | Share |
| Product videos | 45% |
| Educational/instructional | 38% |
| Social media videos | 35% |
| Webinars/live events | 32% |
| Testimonials | 26% |
| Promotional | 27% |
| Sales | 18% |
| Original series | 17% |
| Company culture | 9% |
- 35% make from scratch. 48% use templates.
- 81% add music. 66% voiceovers.
- 39% testimonials most popular.
- 78% plan more videos.
- Barriers: 20% say expensive. 15% don’t know start. 12% unclear ROI. 10% feel no need.
- 39% in-house. 38% smartphone.
- Spend: $100-$1000 per video.
- 64% add captions.
- 30% product demos. 20% knowledge base. 29% announcements.
- From Reddit: AI evolves video. One user notes AI breaks barriers. Quora echoes: AI for SEO video.
Apply: Try AI tools. Generate scripts. Save time. Test templates.
Video Marketing for Social Media
- Social videos view 48% more.
- 17% use live.
- YouTube: 88% prefer.
- 500 hours uploaded/min.
- 16% watch vlogs for research.
- 93% rate video key.
- 80% personalize ads.
- Google results: 62% include video. 80% YouTube.
- Mobile YouTube: 2x attention vs. TV.
- 90% use webinar software for live.
- Instagram: 90% follow businesses.
- Facebook: 8B daily views. 73% use ads. 16-20 sec best conversion.
- LinkedIn: 38% create video. 75% success.
- From Reddit trends 2025: More AI, local content. Repurpose videos.
Apply: Post on YouTube first, then repurpose content for TikTok. Personalize your videos for different platforms and track engagement. Use a social media proxy to monitor performance across multiple channels, ensuring you’re optimizing your strategy and reaching the right audience.
Video Ad Spending Statistics
- Spending hits $456B by 2025.
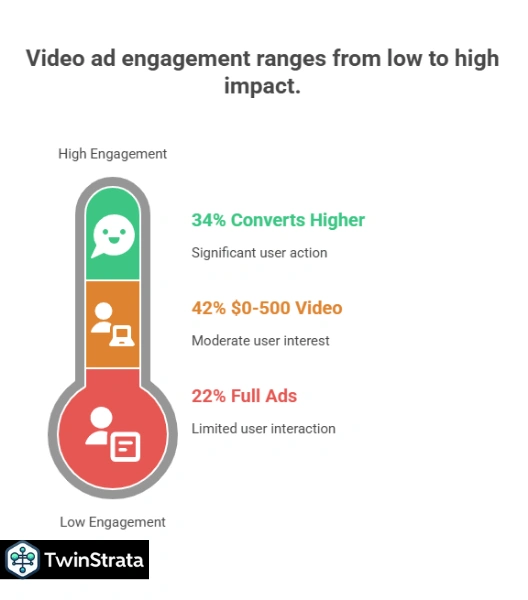
- 42% spend $0-500 per video.
- Increase budget 25% yearly.
- 34% higher conversions with video.
- Full-page ads: 22% more engagement.
- 35% use analytics software.
- From discussions: YouTube ads rise. One Reddit post: More mid-video ads.
Apply: Budget smart. Start low. Use data to scale.
Emerging Trends from Quora and Reddit
- Communities buzz about 2025.
- On Reddit: Short-form rules. AI edits videos. One user: Strategies fail, adapt OK.
- Quora: SEO-video link. AI transforms.
- New: Silent videos trend. Add captions. User-generated up.
- Vertical beyond shorts.
- Viewer retention improves. Daily habits monitor.
Apply: Join forums. Ask questions. Test trends.
How to Use These Statistics for Your Benefit
You read the stats. Now act.
- Assess Current Strategy: Check usage. If below 89%, start.
- Focus on ROI: Aim for 90% positive. Track sales post-video.
- Engage Audiences: Use short-form. Target 50% engagement.
- Optimize Consumption: Mobile-first. Vertical format.
- Produce Smart: AI for 75%. Save costs.
- Social Push: YouTube base. Personalize.
- Ad Invest: $456B market. Start small.
- Trend Watch: From communities, AI key.
Test one change. Measure. Scale wins.
FAQs about Video Marketing Statistics
1. How many businesses use video marketing in 2025?
About 89% to 91% of businesses use video marketing as a core strategy, with many seeing it as essential for reaching customers effectively.
2. How much of internet traffic comes from videos?
Videos account for 82% to 82.5% of all internet traffic in 2025, making them the dominant form of online content.
3. How much time do people spend watching videos daily?
People spend an average of 100 minutes per day watching online videos, with some estimates suggesting up to 4 hours daily in the U.S.
4. What type of video content is most popular?
Short-form videos, like TikTok and Instagram Reels, are the most engaging, with 66% of consumers preferring videos under 1 minute.
5. How does video marketing affect sales?
Videos drive sales, with 78% to 87% of businesses reporting increased sales after using video content to influence purchase decisions.
Also Read:
Conclusion
The video marketing statistics for 2025 highlight its dominance, with 91% of businesses using it and 90% seeing a return on investment. Consumers watch an average of 17 hours of video each week.
This presents a great opportunity for businesses to create engaging content that connects with users and drives growth. To stay ahead, keep up with trends on platforms like Quora and Reddit. Video is the future of marketing, so it’s time to start using it today.