Our smartphones are no longer just phones; they are our digital command centers, powered by an astonishing array of applications.
If you are an entrepreneur looking to launch the next big app, a business owner wanting to enhance your digital presence, or simply someone curious about the forces shaping our mobile world, understanding mobile app download statistics in 2025 is absolutely crucial.
This comprehensive guide dives deep into the latest trends, user behaviors, and market dynamics to give you a clear picture of where the mobile app industry is headed and how you can capitalize on its immense potential.
The world of mobile apps is a dynamic, ever-expanding universe, with billions of downloads annually showcasing their profound impact on our daily lives. This digital revolution shows no signs of slowing down, making informed decisions vital for anyone involved.
The App Economy: A Glimpse into the Numbers
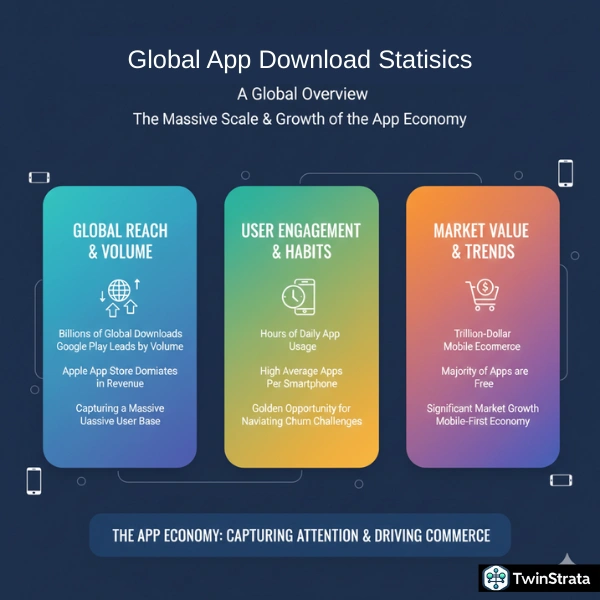
Let’s start by looking at some foundational mobile app download statistics that paint a vivid picture of the current landscape:
- Free Dominance: A staggering 97% of all mobile apps are free to download. This accessibility is a cornerstone of their widespread adoption. Free Android apps specifically account for 97%, with paid apps making up a mere 3%.
- Massive Spending: In Q2 2025, global consumers spent an astounding $40 billion on mobile apps. This figure highlights the significant revenue potential within the app ecosystem, even with a majority of free downloads.
- Individual Spending: By Q3 2023, the average consumer spent $5.05 per smartphone, a seemingly small number that collectively adds up to billions.
- eCommerce Powerhouse: The mobile eCommerce market is projected to reach an incredible $3.35 trillion by 2028. This forecast underscores the growing importance of apps as shopping platforms and revenue generators.
These numbers confirm that apps are not just entertainment; they are serious business.
Also read about: Smartphone Usage Statistics
User Behavior: Beyond the Download Button
While downloading an app is the first step, understanding how users interact with them afterwards is key to long-term success. We install many apps, but only a select few become part of our daily rhythm.
- App Hoarding vs. Daily Use: The average smartphone user keeps about 80 apps installed. However, they actively use only 9 apps daily and revisit around 30 apps monthly. This gap between installed and used apps emphasizes the importance of user engagement and retention strategies.
- Time Sinks: Users dedicate an average of 4 hours and 37 minutes daily to mobile apps. This substantial screen time offers a massive opportunity for businesses to connect with their audience.
- Growing Engagement: The monthly time spent on mobile apps in 2024 reached 1.12 trillion minutes, showing a significant 13.01% growth from 2023. This upward trend indicates that apps are increasingly central to our lives.
- Category Domination: A significant 62.30% of this app usage time goes to communication, entertainment, shopping, and social media apps. These categories are clearly the heavyweights in terms of user engagement.
- Mobile’s Influence: Mobile devices drive nearly 64% of website visits and 59% of online orders. This data solidifies mobile’s role as a primary gateway for consumer interaction and purchasing.
Also read about: Mobile Internet Traffic Statistics
Advertising: Capturing Attention in a Crowded Market
Mobile advertising remains an incredibly powerful tool for capturing user attention and generating revenue. Businesses that strategically invest in well-targeted ad campaigns can significantly boost their app’s visibility and unlock its revenue potential.
- Ad Recall: 47% of users remember app ads, which is a higher recall rate compared to 46% for mobile web ads and 36% for desktop ads. This demonstrates the effectiveness of in-app advertising.
- Monetization Growth: Apps that leverage mobile ad networks for monetization are expected to grow by 60%. This indicates a robust and expanding market for in-app advertising revenue.
The Retention Riddle: Why Apps Get Uninstalled
Despite their popularity, apps face significant retention challenges. Many users uninstall apps shortly after installation, making it critical for developers and businesses to focus on keeping users engaged.
- The Seven-Day Drop-Off: A staggering 56% of mobile apps are uninstalled within just 7 days. This rapid churn rate demands attention.
- Reasons for Uninstallation: Users uninstall apps for several key reasons:
- Large Memory Space: 50.6% cite high memory requirements as a reason.
- Complex Registration: Difficult or lengthy sign-up processes deter users.
- Privacy and Security Concerns: 29.6% worry about their data.
- Persistent Notifications: 71% find constant notifications annoying.
- Performance Issues: 62% uninstall due to slow performance or bugs.
- Daily Active User (DAU) Loss: On average, an app loses 77% of its daily active users over time. This alarming statistic highlights the constant need for improvement and user re-engagement.
To combat these challenges, businesses should consider developing Progressive Web Apps (PWAs) and Lite versions.
These alternatives address app size concerns and can significantly enhance user retention by offering a faster, more lightweight experience without requiring a full download.
Also read about: Social Media Statistics
Global Dominance: Where Apps Reign Supreme
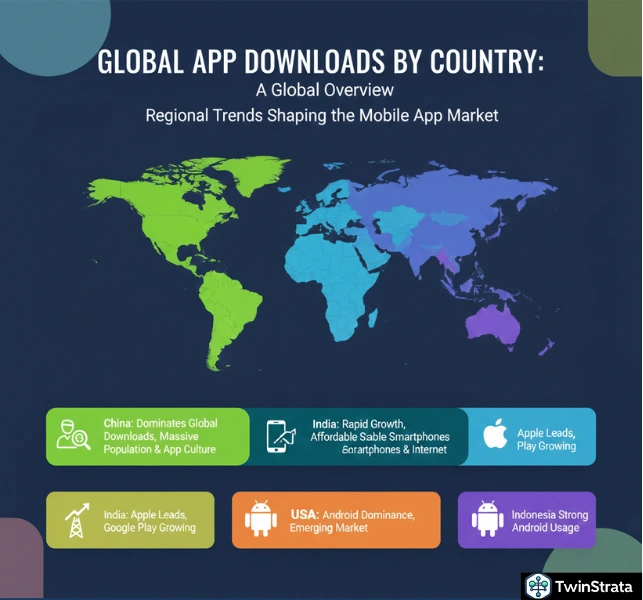
Certain countries lead the global app download market, demonstrating the varied pace of digital adoption and smartphone penetration around the world.
- China’s Leadership: China continues its dominance, recording an incredible 113 billion app downloads in 2023.
- India’s Surge: India follows with 26 billion downloads, reflecting the country’s booming digital economy and increasing smartphone accessibility.
Here are the top 5 countries by mobile app downloads, offering a snapshot of global leadership:
| Countries | Mobile App Downloads (in billions) |
| India | 75 |
| China | 62 |
| USA | 35 |
| Brazil | 28 |
| Indonesia | 18 |
Note: These figures show significant regional variations, with some countries showing different leading positions in specific quarters.
Across all markets, the time users spend on mobile apps is consistently increasing each year. Countries like India and Italy, for instance, saw a remarkable 30% growth in average time spent using apps between 2019 and 2020, indicating a growing global reliance on mobile applications.
Top App Categories and Emerging Trends
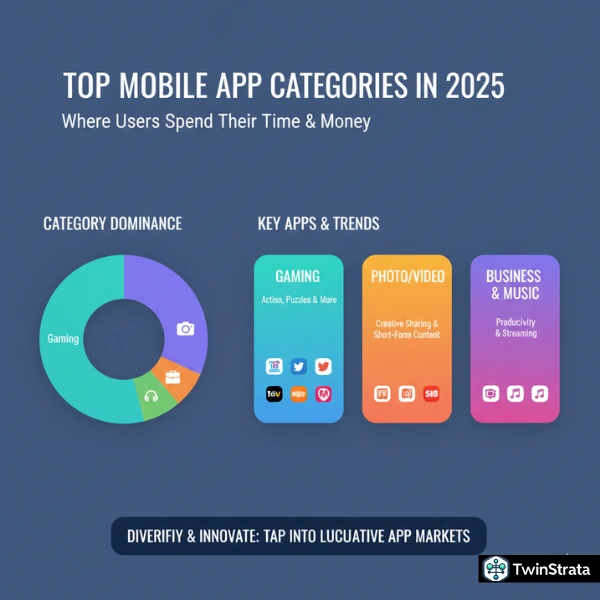
The gaming category consistently rules the mobile app market, maintaining its position as the most downloaded category globally. However, other categories are also carving out significant market shares.
Top Mobile App Categories for 2024:
- Gaming Dominance: Between 2023 and 2024, games accounted for over 49% of all app downloads worldwide. This category remains a massive revenue driver and engagement magnet.
- Visual Content: Photo and video apps ranked second, representing 10% of all downloads. The demand for creating and consuming visual content is incredibly high.
- Business and Music: Categories like business and music apps captured a smaller but notable market share, each contributing 4% of global downloads. This shows diversification in app usage.
Platform Powerhouses: Apple App Store vs. Google Play Store
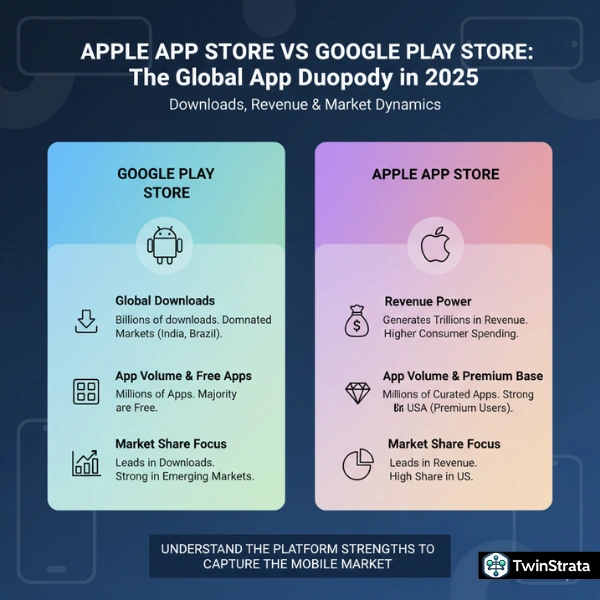
When it comes to downloading mobile apps, the Apple App Store and Google Play Store are the undisputed giants, serving as the primary platforms for iOS and Android users, respectively. Let’s compare how these two titans stack up.
Google Play’s Install Leadership:
Google Play continues to lead in app installs, significantly outpacing the Apple App Store.
- In 2025, Google Play witnessed 299 billion new app installs, marking an 8% year-over-year increase from 277 billion installs in 2024.
- On average, 74% of downloads in the Top 10 countries originate from the Google Play Store, underscoring Android’s global reach.
- In countries like India, Indonesia, Brazil, and Mexico, an astonishing 90% of downloads come from the Google Play Store, highlighting Android’s overwhelming dominance in these emerging markets.
Apple App Store’s Niche Strength:
Conversely, the Apple App Store recorded fewer installs globally, though it holds a strong position in specific regions and often generates higher revenue per user.
- In the United States, the Apple App Store leads with 63% of downloads, though the Google Play Store is capturing a growing 40% share, indicating a tightening competition even in traditionally iOS-heavy markets.
This data tells us that while Google Play boasts a larger volume of downloads due to Android’s wider global market share, the Apple App Store remains a critical platform, especially in affluent markets, often characterized by higher user spending.
The Rise of ChatGPT and Other Top Apps
The app landscape is constantly shifting, with new players emerging and existing ones evolving.
Recent statistics highlight the meteoric rise of AI-powered applications and the continued strength of social media and shopping platforms.
Most Popular Apps Worldwide (July 2025):
| App | July 2025 Downloads Worldwide (in millions) |
| ChatGPT | 52 |
| TikTok | 39 |
| 38 | |
| 30 | |
| 27 | |
| Temu | 26 |
| CapCut | 23 |
| Threads | 23 |
| Telegram | 20 |
| Snapchat | 20 |
Note: This includes downloads of lite app versions where available.
ChatGPT’s rise to the top spot in both July and June 2025, with 52 million and 50 million downloads respectively, signifies a massive shift towards utility and AI-driven applications.
This is a crucial insight for developers considering new app ideas. Social media giants like TikTok, Instagram, and Facebook continue to dominate, showing the enduring human need for connection and entertainment.
Shopping apps like Temu are also making a significant impact, reflecting the ongoing surge in mobile commerce.
Most Popular Apps by Country (Q2 2025):
The popularity of apps varies significantly by country, influenced by local culture, existing infrastructure, and market penetration.
- United States: ChatGPT led the way, followed by TikTok and Threads.
- United Kingdom: ChatGPT was again number one, with shopping app Temu in second place.
- Australia: ChatGPT also took the top spot, with streaming service HBO Max following.
- Canada: ChatGPT was the most downloaded app, with Temu securing the second position.
- India: Instagram secured the top spot, followed by local video app Kuku TV and then ChatGPT. This highlights the strong local preferences and the power of visual content in India.
- France: ChatGPT was the most downloaded app, with Temu and Klarna (a financial app) next in line.
- Brazil: ChatGPT led the downloads, with Temu and TikTok close behind.
This country-specific data is invaluable for businesses looking to expand into new markets, showing the importance of localized strategies.
Looking Back: Top Apps of Previous Years (2020-2023)
Understanding historical trends gives us context for the current app landscape.
2023: Threads, the text-based social media app from Meta, claimed the top spot in the US with 192.7 million downloads. This shows how quickly new social platforms can gain traction. Temu and TikTok also had massive download numbers.
2022: TikTok was the global leader with 672 million downloads, cementing its position as a cultural phenomenon. Instagram and WhatsApp also showed strong performance.
2021: TikTok again led with 656 million downloads, maintaining its consistent growth. Facebook and Instagram continued to be major players.
2020: During the peak of the pandemic, TikTok recorded an astounding 850 million downloads. WhatsApp, Facebook, and Zoom also saw massive surges in downloads as people relied on digital communication and connection.
These historical snapshots demonstrate the rapid evolution of app preferences, the consistent power of social media, and the adaptability of users to new technologies and global events.
What Users Are Asking: Insights from Quora and Reddit
To provide the freshest insights, we turn to common questions and discussions users are having on platforms like Quora and Reddit. These provide a pulse on real-world concerns and interests related to mobile apps.
- “What are the best apps to replace X (e.g., social media, streaming service)?” Users are actively seeking alternatives, especially those that offer better privacy, unique features, or less intrusive advertising. This indicates a growing demand for niche apps and those that prioritize user experience.
- “Why is [specific app] using so much data/battery?” Performance concerns remain paramount. Users are highly sensitive to apps that drain their battery or consume excessive data, often leading to uninstallation. This reinforces the need for optimized app development.
- “How can I reduce screen time on my phone without deleting apps?” This question reveals a desire for digital well-being features and conscious app usage. Apps that offer usage monitoring or “digital detox” options are gaining interest.
- “Are there any new productivity apps that actually work?” The search for efficient tools continues. Users are looking for apps that genuinely enhance productivity, streamline tasks, and integrate seamlessly with their workflows, moving beyond simple to-do lists.
- “What are the privacy implications of using [new popular app]?” With data breaches and privacy concerns on the rise, users are increasingly scrutinizing app permissions and data collection practices. Transparency and robust privacy features are becoming non-negotiable.
These discussions highlight that beyond just downloads, users care deeply about performance, privacy, utility, and their overall digital well-being. Developers and businesses must address these concerns to build trust and ensure long-term user retention.
FAQs About Mobile App Download Statistics
1. What’s driving mobile app downloads in 2025?
Accessibility, with most apps being free and growing smartphone use globally.
2. Why do apps get uninstalled quickly?
Large memory usage, complex registration, privacy issues, and slow performance.
3. How can businesses use download stats?
Target high-growth markets, improve retention, and draw inspiration from top apps.
4. Are paid apps still viable?
Yes, paid apps thrive by offering unique value or premium features.
5. What trends are shaping mobile apps in 2025?
AI-powered apps, privacy demands, digital well-being, and the rise of PWAs and Lite apps.
Also Read:
- Spotify Statistics
- Google Ads Statistics
- Generative AI Statistics
- Content Marketing Statistics
- Email Marketing Statistics
Wrapping It Up: Your Path to App Success
The mobile app landscape in 2025 is rapidly evolving, with app downloads and usage consistently growing across all major markets. From the global dominance of China and India in terms of downloads to the meteoric rise of AI-powered applications like ChatGPT, the opportunities are vast.
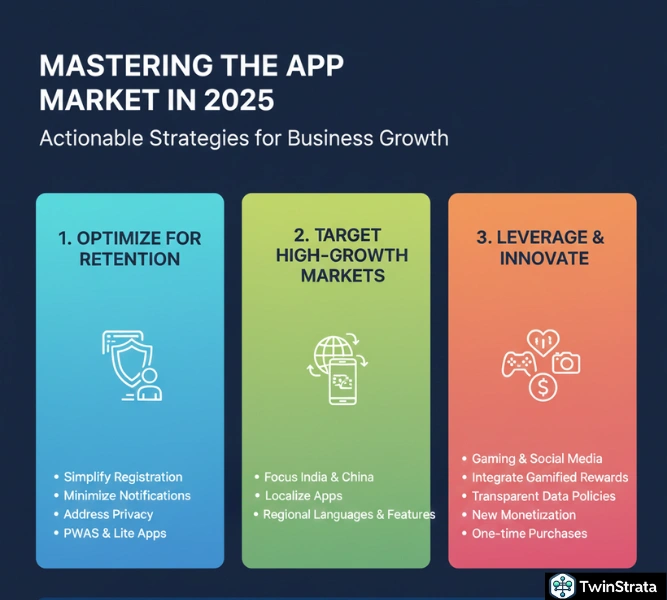
To succeed in this dynamic environment, you must go beyond just building an app. You need to understand user behavior, address their pain points (like retention challenges), strategize your monetization, and localize your efforts for specific markets.
Whether you are targeting high-download countries, leveraging platform-specific preferences, or innovating with new technologies, aligning your goals with these mobile app trends is absolutely crucial for success.
The future of mobile apps is here, and it is more vibrant and impactful than ever before.
Source: Statista, Business Of Apps