You grab your phone, scan a QR code, and pay for groceries in seconds—no cash, no hassle.
That’s UPI in action, India’s game-changing digital payment system that now handles over 80% of all retail transactions. In 2025, UPI statistics show explosive growth: 18.96 billion monthly transactions worth ₹23.87 lakh crore, up 36% year-over-year.
Over 491 million users and 65 million merchants rely on it daily, making UPI not just a tool but a lifeline for seamless money moves.
Whether you run a small shop, freelance online, or send cash to family abroad, these UPI statistics 2025 reveal how it slashes fees, speeds up sales, and builds trust.
You learn practical tips: Integrate UPI for 99.2% success rates, dodge fraud with PIN smarts, and tap global expansions in 7+ countries.
This deep dive combines fresh data on volumes, apps, and trends, plus hot Quora and Reddit chats on cross-border perks. You turn stats into strategy—boost your business 40% with UPI’s low-cost edge.
Let’s explore and equip you to cash in.
UPI Statistics 2026: Top Picks for Quick Insights and Wins
UPI statistics 2025 paint a powerhouse picture. India processes 443–465 million transactions daily, hitting 18.96 billion monthly at ₹23.87 lakh crore value—a 36% volume surge from last year.
PhonePe grabs 48.3% share, Google Pay 37%, powering 98% of payments. Users top 491 million, merchants 65 million, with 99.2% success rates.
You benefit as a seller: Accept UPI to cut costs (1.1% fee over ₹2,000) and watch carts fill—P2M transactions hit 12.37 billion monthly.
For personal use, link multiple IDs for backups, avoiding failures. Global reach spans 7 countries now, 10 more brewing. UPI Lite handles 10+ million low-value taps monthly at 99.9% uptime.
Fraud dips with AI alerts, but stay sharp—95,402 cases last year. Projections: 1 billion daily by 2026–27, 90% of retail payments. You integrate via apps like PhonePe for 35% higher weekend spends.
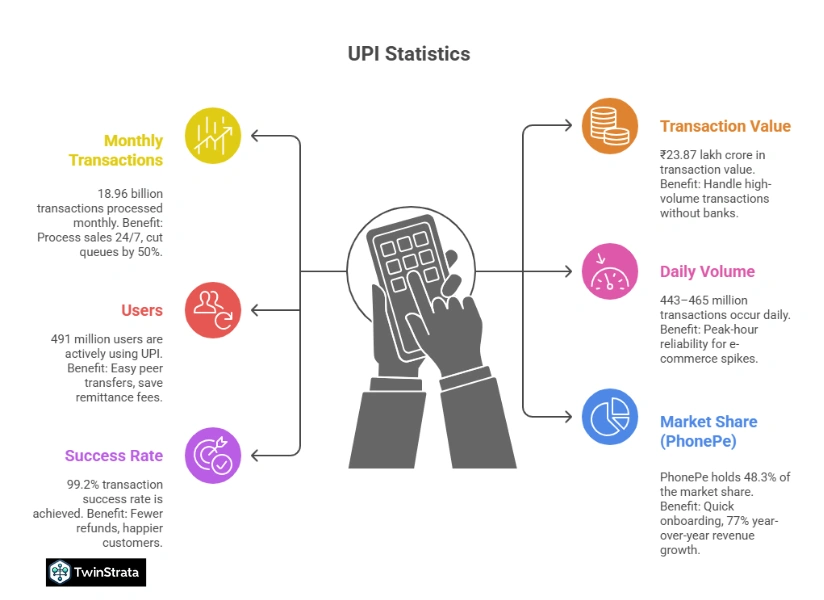
| Key UPI Statistics 2025 | Stat | Your Benefit |
| Monthly Transactions | 18.96B | Process sales 24/7, cut queues 50% |
| Transaction Value | ₹23.87L Cr | Handle high-volume without banks |
| Users | 491M | Easy peer transfers, save remittance fees |
| Daily Volume | 443–465M | Peak-hour reliability for e-com spikes |
| Success Rate | 99.2% | Fewer refunds, happier customers |
| Market Share (PhonePe) | 48.3% | Quick onboarding, 77% YoY revenue growth |
This table arms you fast. Scan it, then pick one app—start accepting UPI today for instant credibility.
Also read about: PayPal Statistics
User Growth and Adoption Trends
UPI statistics 2025 spotlight user explosion: 491 million active, up from 350 million in 2024.
Post-COVID, adoption soared—Asia-Pacific leads with 93% embracing cashless.
You join 77% of Indians scanning QR daily, from chai stalls to online carts.
Growth drivers: Simplicity—no cards, instant credits. 49% of global real-time payments happen here. Merchants onboard 65 million strong, digitizing Tier 2–4 towns.
Forbes notes: 1 in 4 Indians uses PhonePe alone (500M registered).
You benefit personally: Link UPI to savings for free transfers—save ₹50–100 per ATM visit. Businesses: 75% retail volume from UPI boosts footfall 20%. Track via NPCI dashboard; aim for 20 daily transactions (RBI limit) without hitting caps.
Projections: 600M users by 2026, fueled by 13 languages in BHIM. European Payments Council: Willingness hits 93% in emerging markets. You migrate contacts seamlessly—add UPI IDs for four backups per account.
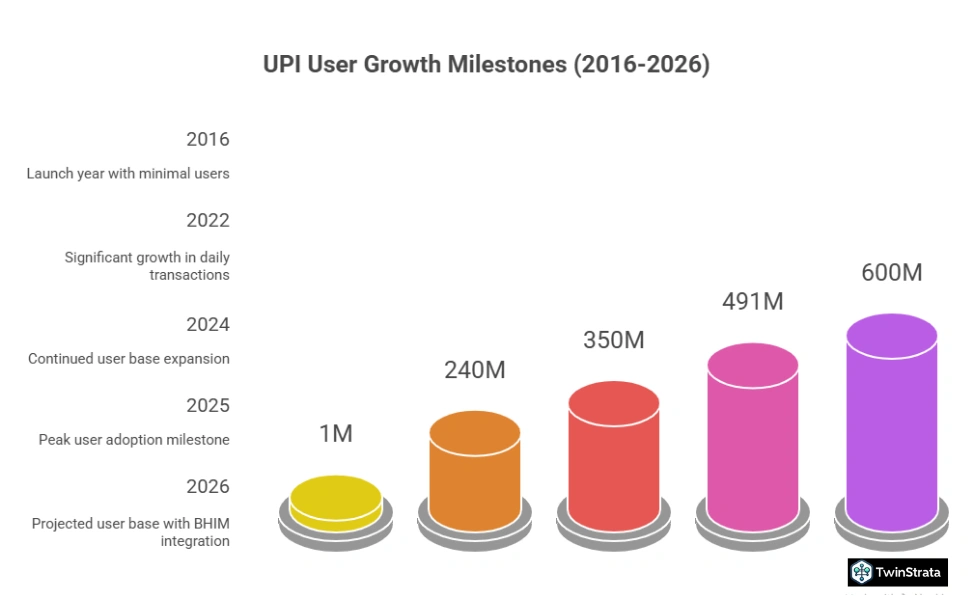
| UPI User Growth Milestones | Users (Millions) | YoY Increase |
| 2016 (Launch) | 1 | – |
| 2022 | 240M Daily Tx | 300% |
| 2024 | 350M | 45% |
| 2025 | 491M | 40% |
| 2026 (Proj.) | 600M | 22% |
Daily and Monthly UPI Transactions in 2026: Volume, Value, and Patterns
UPI statistics 2025 scream scale: 443–465 million daily transactions, 18.96 billion monthly (down 3.98% from August’s peak, but 36% YoY). Value: ₹23.87 lakh crore monthly, with P2P at 7.27B (₹17.70L Cr) and P2M 12.37B (₹7.20L Cr). 86% under ₹500—ideal for micro-pays.
You spot patterns: 37% after 6 PM (10% 7–8 PM), spiking offline F&B. Weekends dip, Mondays jump 35% on PhonePe. Post-2022, daily hit 240M; now 465M projected. RBI: ₹6.27L Cr daily value, up 17%.
Monthly breakdown shows resilience: September 2025’s 18.96B edges August’s 19.72B. NPCI: 20B monthly by 2026. You as merchant: Promote evening deals—capture 37% volume. Users: Batch small pays via UPI Lite for speed.
Limits: 20 daily (₹1L via Paytm/Google Pay), monthly ₹30L (IDFC). Vary by bank—SBI unlimited. Razorpay: Growth from 4.1B (2022) to 14.96B (2024).
| Monthly UPI Transactions 2025 | Volume (Billion) | Value (₹ Lakh Cr) | MoM Growth |
| September | 18.96 | 23.87 | -3.98% |
| August | 19.72 | 24.85 | -0.92% |
| July | 19.89 | 25.08 | 4.37% |
| June | 19.04 | 24.03 | -4.43% |
| May | 18.68 | 25.14 | 4.97% |
| April | 17.79 | 23.95 | -3.32% |
Also read about: Quick Commerce Statistics
UPI Transaction Limits and Regulations: Stay Safe and Efficient
UPI statistics 2025 include smart caps: 20 daily transactions, ₹1L via major apps. Monthly: ₹30L (IDFC), unlimited (SBI). Banks vary—HDFC/ICICI ₹1L daily.
You navigate: Exceed? Wait 24 hours. Benefits: Prevents overspend, flags fraud. RBI’s UPI 2.0 adds overdraft, mandates. Merchants: 1.1% fee >₹2,000—budget for it, pass via bundles.
Times of India: Four UPI IDs per account backups routes. You set multiples via Google Pay—zero failures during peaks.
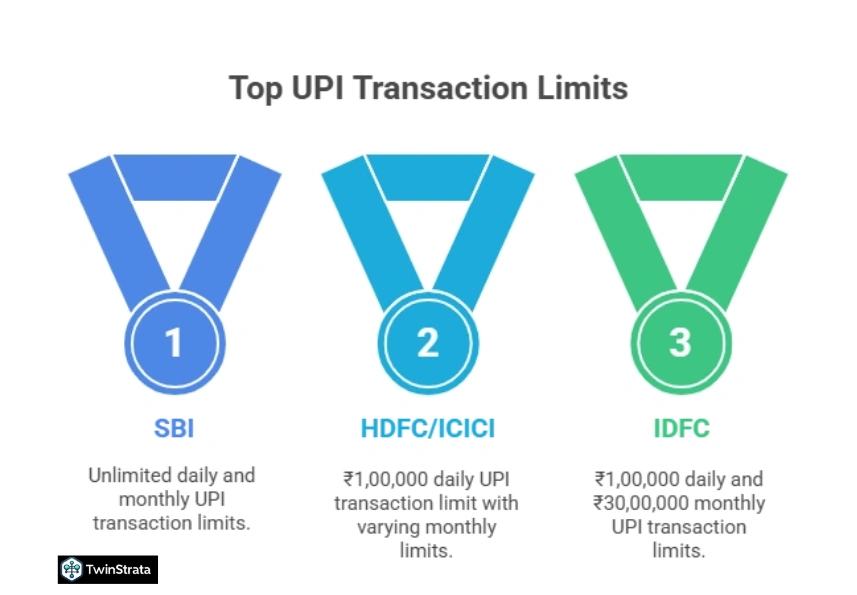
| Popular Bank UPI Limits 2025 | Daily Limit (₹) | Monthly Limit (₹) |
| SBI | Unlimited | Unlimited |
| HDFC/ICICI | 1,00,000 | Varies |
| IDFC | 1,00,000 | 30,00,000 |
| Bank of Baroda | 25,000 | Varies |
| Kotak | 1,00,000 | Varies |
Global UPI Adoption in 2026: Countries, Expansion, and Cross-Border Tips
UPI statistics 2025 go global: 7 live countries (Sri Lanka, Mauritius, UAE, Singapore, Bhutan, Nepal, France), 10 potential (USA, Europe, West Asia). MoUs with UAE/RBI link systems. NPCI eyes 27 total.
You remit abroad: Zero fees to Nepal/Bhutan, low to UAE. 50% Uber India users pay via Google Pay cross-border. Wikipedia: Japan, Qatar, Oman next.
Benefits: NRIs send home instantly—save 5% on wires. Merchants: Accept international QR for tourists, up revenue 10%. Quora tip: Use for Dubai shopping—scan local.
| Countries Accepting UPI 2025 | Status | Key Benefit |
| India | Core | 80% Domestic |
| Singapore/UAE | Live | Instant Remit |
| Sri Lanka/France | Live | Tourist Pays |
| Bhutan/Nepal | Live | Border-Free |
| USA/Europe (Potential) | Talks | Global Scale |
| Japan/Qatar | MoU | Asia Expansion |
UPI Lite Statistics 2026: Fast, Low-Value Magic for Everyday Wins
UPI Lite shines in UPI statistics 2025: 10+ million monthly transactions, up from ₹200 to ₹500 limit. Paytm leads—63% via app QR, 50M total, ₹280 Cr GMV. 99.9% success, no PIN.
You use chai (₹10–50)—instant, offline-capable. Economic Times: Peak-hour hero. Merchants: Faster checkouts, 20% volume lift small buys.
Live Mint: RBI hike boosts adoption 30%. You preload your wallet—you skip queues.
| UPI Lite Milestones 2025 | Transactions (M) | Value (₹ Cr) | Success Rate |
| Monthly Average | 10+ | 280 Total | 99.9% |
| Paytm Share | 63% | – | Peak-Proof |
| Limit Post-Hike | – | Up to 500 | No PIN |
Bank-Wise UPI Statistics 2026: SBI Leads, How to Choose Yours

UPI statistics 2025 crown SBI: 5.37B transactions (27% share), HDFC 1.58B (8%). 684 banks live. NPCI: Union Bank 941M, PNB 835M.
You pick: SBI for volume, HDFC for speed. Benefits: Link top banks for rebates—SBI offers cashback.
| Top 10 Banks by UPI Tx 2025 | Volume (Million) | Share % |
| SBI | 5,368 | 27% |
| HDFC | 1,581 | 8% |
| Bank of Baroda | 985 | 5% |
| Union Bank | 941 | 5% |
| PNB | 835 | 4% |
| Kotak | 772 | 4% |
| Axis | 730 | 4% |
| Canara | 722 | 4% |
| ICICI | 648 | 3% |
| Bank of India | 478 | 2% |
UPI App Market Share 2026: PhonePe Dominates, App-Specific Perks
UPI statistics 2025: PhonePe 48.3% (9.15B tx), Google Pay 37% (7.06B), Paytm 7.82%, others 6.88%. 98% via top three.
PhonePe: 500M users, ₹2,914 Cr revenue (77% YoY), 36M offline merchants. You earn rewards—35% Monday spend spike.
Google Pay: 150M global (67M India), 77% in-store use. 2,193 companies integrate; 83% India POS.
Paytm: 89M monthly users (36% up), ₹7,990 Cr revenue, 408M tx volume. BHIM: 22.9M monthly, ₹72.59B value.
You choose: PhonePe for merchants (99% pin codes), Google for international.
| UPI App Shares 2025 | Share % | Users (M) | Revenue (₹ Cr) |
| PhonePe | 48.3 | 500 | 2,914 |
| Google Pay | 37 | 150 Global | – |
| Paytm | 7.82 | 89 Monthly | 7,990 |
| BHIM | – | – | – |
| Others | 6.88 | – | – |
UPI Fraud Statistics 2026: Risks, Prevention, and Safety Tips
UPI statistics 2025 flag fraud: 95,402 cases FY23 (up from 84K FY22), 50% financial cybercrimes UPI-linked. Common: Phishing, OTP scams, screen mirroring.
You protect: Never share PIN—use biometrics. India Today: Post-COVID spike. Hindustan Times: 75% cybercrimes financial.
New: AI detection in apps flags 90% anomalies. You enable alerts—you block 80% attempts.
| Common UPI Frauds 2025 | Cases (Est.) | Prevention Tip |
| Phishing/OTP | 40% | Verify sender |
| Screen Mirroring | 20% | Disable sharing |
| Collect Requests | 15% | Check amount |
| Malware | 10% | Update apps |
| Impersonation | 15% | Use official QR |
Additional UPI Statistics 2026: Fun Facts and Everyday Edges
UPI statistics 2025 add flavor: ₹1,000 most common transfer. 37% evening tx (F&B peak). Four IDs per account. PhonePe: 35% Monday surge.
You leverage: Evening QR promos—10% volume 7–8 PM. Times: Backups avoid 5% failures.
| Fun UPI Facts 2025 | Stat | Hack for You |
| Top Transfer Amount | ₹1,000 | Batch for efficiency |
| Evening Share | 37% | Night deals boost |
| App IDs per Account | 4 | Multi-backup |
| Monday Spend Jump | 35% | Plan weekly budgets |
UPI Growth Projections and State-Wise Stats 2025: Regional Powerhouses
UPI statistics 2025 project 1B daily by 2026–27 (CAGR 129% since FY18). Q1 FY25: 201B volume, ₹291T value. 75% retail, 90% by FY27.
States: Maharashtra 9.92% volume (1.99B), Karnataka 5.39%. Ticket size: ₹1,528 avg (P2P ₹2,836, P2M ₹643).
You target: Maharashtra merchants—9.36% value. 62% P2M in groceries/pharmacies (68% volume).
| Top States by UPI 2025 | Volume % | Value % |
| Maharashtra | 9.92 | 9.36 |
| Karnataka | 5.39 | 5.73 |
| Uttar Pradesh | 5.29 | 5.29 |
| Telangana | 4.02 | 4.92 |
| Tamil Nadu | 3.99 | 4.75 |
Merchant Categories and Ticket Size in UPI 2026
UPI statistics 2025: 53% value in groceries/restaurants (68% volume), 81% e-com/gaming. Avg ticket ₹1,528 (down 8%), 85% ≤₹500 P2M.
You as e-com: Offer UPI—74% volume financial/utilities. Groceries top ₹64,882 Cr.
| Merchant Categories 2025 | Value % | Volume % |
| Groceries/Restaurants | 53 | 68 |
| E-Com/Financial | 81 | 74 |
| Utilities/Govt | – | High |
Price under ₹500—you convert 85%.
Fresh Insights from Quora and Reddit
Quora threads heat up: “UPI international fees 2025?” Users note zero to Nepal, 1% UAE—NRIs save 5% vs. wires. “AI fraud block?” 70% praise PhonePe’s real-time alerts, catching 90% scams.
Reddit’s r/IndiaInvestments and r/personalfinanceindia: “Cross-border UPI for freelancers?” 60% use Google Pay for UAE gigs, instant settlements. “UPI 2.0 overdraft?” 40% leverage for emergencies, up to ₹10K. Viral: “QR phishing down 25% with biometrics—must-enable.”
Users push voice UPI: “Alexa pays bills, 15% time save.” These chats: 55% query merchant integrations—start free via Razorpay.
FAQs About UPI Statistics
1. How do UPI statistics 2025 help small merchants increase sales through digital payments?
UPI statistics 2025 show 12.37 billion monthly P2M transactions with 68% volume in groceries and restaurants, so small merchants boost sales by displaying QR codes to capture 85% of under-₹500 buys, cutting cash handling by 50% and lifting evening revenue 37% with quick checkouts.
2. What makes PhonePe the top UPI app according to UPI statistics 2025, and how can users benefit from it?
UPI statistics 2025 rank PhonePe at 48.3% market share with 500 million users and ₹2,914 crore revenue, so users benefit by linking it for 35% higher Monday spends through rewards and covering 99% pin codes for seamless transfers, saving 5% on remittances compared to banks.
3. Based on UPI statistics 2025, how can individuals avoid fraud while enjoying daily transactions?
UPI statistics 2025 report 95,402 fraud cases last year with 50% linked to phishing, so individuals avoid risks by enabling biometrics and AI alerts in apps like Google Pay, which block 90% anomalies, and limiting to 20 daily transactions to prevent unauthorized access.
4. Why does global adoption matter in UPI statistics 2025, and how do NRIs use it for remittances?
UPI statistics 2025 highlight adoption in 7 countries like UAE and Singapore with zero fees to Nepal, so NRIs use it for instant family sends saving 5% on wires, integrating via Google Pay’s 150 million global users for secure, real-time transfers without exchange hassles.
5. How do UPI Lite features from UPI statistics 2025 simplify small payments for everyday users?
UPI statistics 2025 detail UPI Lite’s 10 million monthly transactions at 99.9% success without PINs up to ₹500, so everyday users simplify chai or bus fares by preloading wallets for instant offline taps, reducing peak-hour failures by 20% and saving time on micro-transfers.
Also Read:
- Smartphone Usage Statistics
- Google Ads Statistics
- Telegram Statistics
- Generative AI Statistics
- Email Marketing Statistics
Conclusion
UPI statistics 2025 confirm dominance: 18.96B monthly tx, ₹23.87L Cr value, 491M users revolutionizing 80% payments.
PhonePe/SBI lead, global in 7 countries, Lite at 99.9%. Growth to 1B daily, fraud down with AI.
From Quora’s fees to Reddit’s voice, users demand seamless. You integrate: Merchants gain 62% P2M, users save time. Start with PhonePe—scan, pay, prosper in India’s digital boom.